No cache at all
infer/engines/naiveContents
What this engine is
This engine runs on a straightforward decode loop with no optimizations. The prompt goes into the model, the model returns a score for every word in its vocabulary, the highest scoring one is appended to the sequence, and the whole sequence goes back in. That repeats 256 times. There is no KV cache, so nothing is carried from one step to the next, and step 200 recomputes everything steps 1 through 199 already computed.
That loop has two halves and they are measured separately throughout. The first pass, over the prompt, is prefill, and its cost is reported as time to first token: the wait before anything appears. Every pass after it is a decode step, and its cost is reported as inter token latency: the gap between one token and the next.
This engine generates 45.66 tokens/s on a 16 token prompt and 3.60 tokens/s on a 4096 token prompt, which is 12.7 times slower. The length of the prompt causes all of it. Nothing the engine generates along the way contributes.
Setup: Qwen2.5-1.5B in fp16, one NVIDIA A10, greedy decoding from seed 0, 256 new tokens per run, five recorded runs after two warmup runs, batch size 1.
Results
| prompt | prompt tokens | TTFT | total | decode | per token | ITL p95 | peak memory |
|---|---|---|---|---|---|---|---|
| p16 | 16 | 22.1 ms | 5.606 s | 45.66 tok/s | 21.9 ms | 23.7 ms | 2.90 GiB |
| p64 | 64 | 21.3 ms | 5.661 s | 45.22 tok/s | 22.1 ms | 25.3 ms | 2.91 GiB |
| p256 | 256 | 22.2 ms | 7.291 s | 35.08 tok/s | 28.5 ms | 32.7 ms | 2.92 GiB |
| p1024 | 1024 | 61.6 ms | 18.694 s | 13.69 tok/s | 73.1 ms | 81.4 ms | 2.96 GiB |
| p4096 | 4096 | 255.5 ms | 71.146 s | 3.60 tok/s | 278.0 ms | 284.5 ms | 3.16 GiB |
TTFT is time to first token and ITL is inter token latency, the two
quantities named above. total is mean wall clock per run. TTFT and the two
latency percentiles are medians across the five runs, which is what the
figures plot. Decode throughput is the 255 tokens after the first divided by
the time to produce them, so prefill is excluded from it, and per token is
the same quantity inverted. Peak memory is against 2.88 GiB of weights and
22.06 GiB visible on the card, so nothing here is close to full.
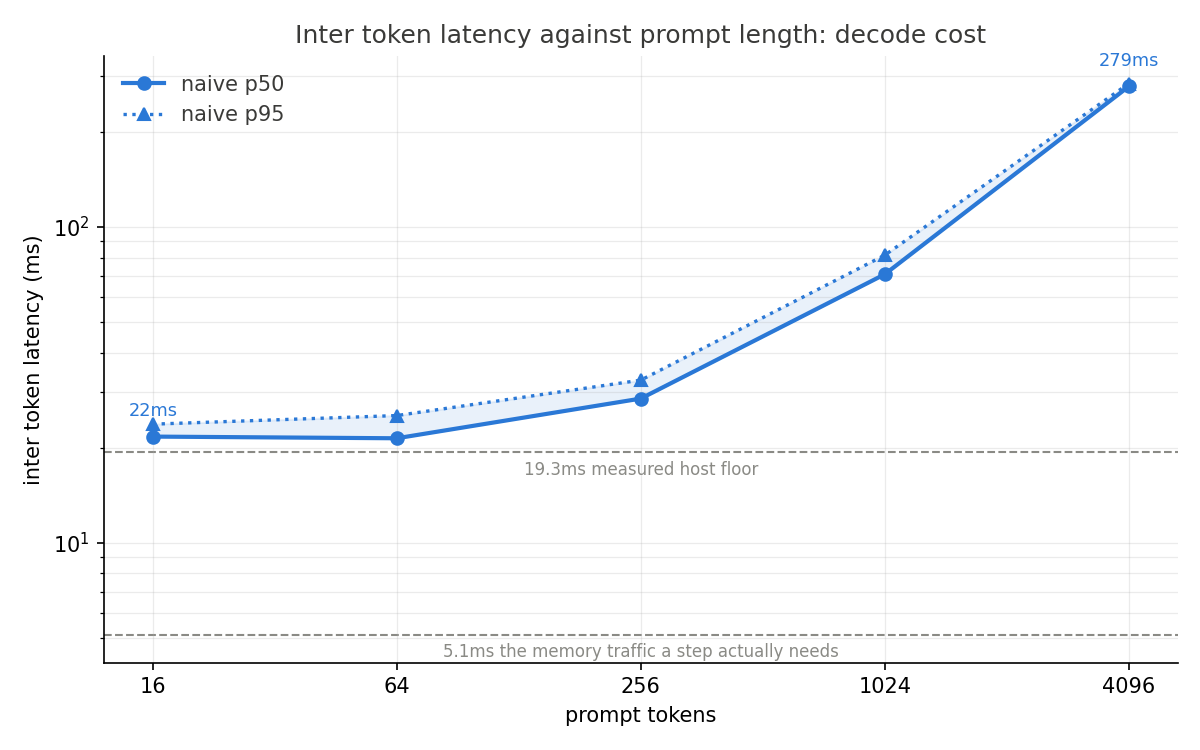
The two dashed lines are the controls this part measures against. The upper one, at 19.32 ms, is what a forward pass costs before the GPU does anything useful, measured in the next section. The lower one, at 5.15 ms, is the memory traffic a step needs: producing one token requires reading all 3.09 GB of the model's weights, and at the A10's 600 GB/s that takes 5.15 ms. The three shortest prompts sit on the upper line, and the next section is about why.
All five runs of a given prompt produce byte identical output. The sampling is greedy, which takes the largest logit at every step, so the same prompt and the same model state give the same token every time.
The floor every step sits on
To measure the floor I ran a forward pass over a single token, which is the smallest amount of GPU work the model can be asked to do, so whatever it costs is close to pure overhead.
It costs 19.32 ms, and 18.54 ms of that is the CPU. One forward pass is 1,123 separate instructions to the GPU, and issuing each costs the host, the CPU side of the program, about 16.5 µs whether or not there is work inside it.
Why the short prompts all run at the same speed
p16 and p64 have a 1% speed difference across a 4x change in prompt length. The floor is one reason for that. The other is how much arithmetic each step performs.
The unit for that is a token forward: one token making one pass through the
model. Step i processes P + i tokens, so generating 256 tokens costs
Σ(P + i) for i in 0..255 = 256·P + 32,640
At a 16 token prompt that is 4,096 + 32,640 = 36,736 token forwards. At a 4096 token prompt it is 1,048,576 + 32,640 = 1,081,216.
That constant is the generated tokens paying for themselves, and it comes from
Σ(0, 1, …, 255) = 255 · 256 / 2 = 32,640. It dominates until the prompt
reaches about 128 tokens, so below that the arithmetic barely changes with the
prompt.
The two accounts separate as the prompt grows:
| step | token forwards grow | time grows |
|---|---|---|
| p16 → p64 | 1.33x | 1.01x |
| p64 → p256 | 2.00x | 1.29x |
| p256 → p1024 | 3.00x | 2.56x |
| p1024 → p4096 | 3.67x | 3.80x |
Time rises far more slowly than work at the short end, because the floor absorbs it. From p64 to p256 the engine performs 2x the arithmetic for 1.29x the time. By p1024 the floor is nearly used up. In the last row time finally rises faster than token forwards do, because a token forward counts every token equally and attention does not: attention's cost grows with the square of the sequence.
The same reasoning explains why time to first token is flat at 16, 64 and 256 tokens. Prefill at those lengths is not measuring prefill. It is measuring the fixed cost of issuing a forward pass.
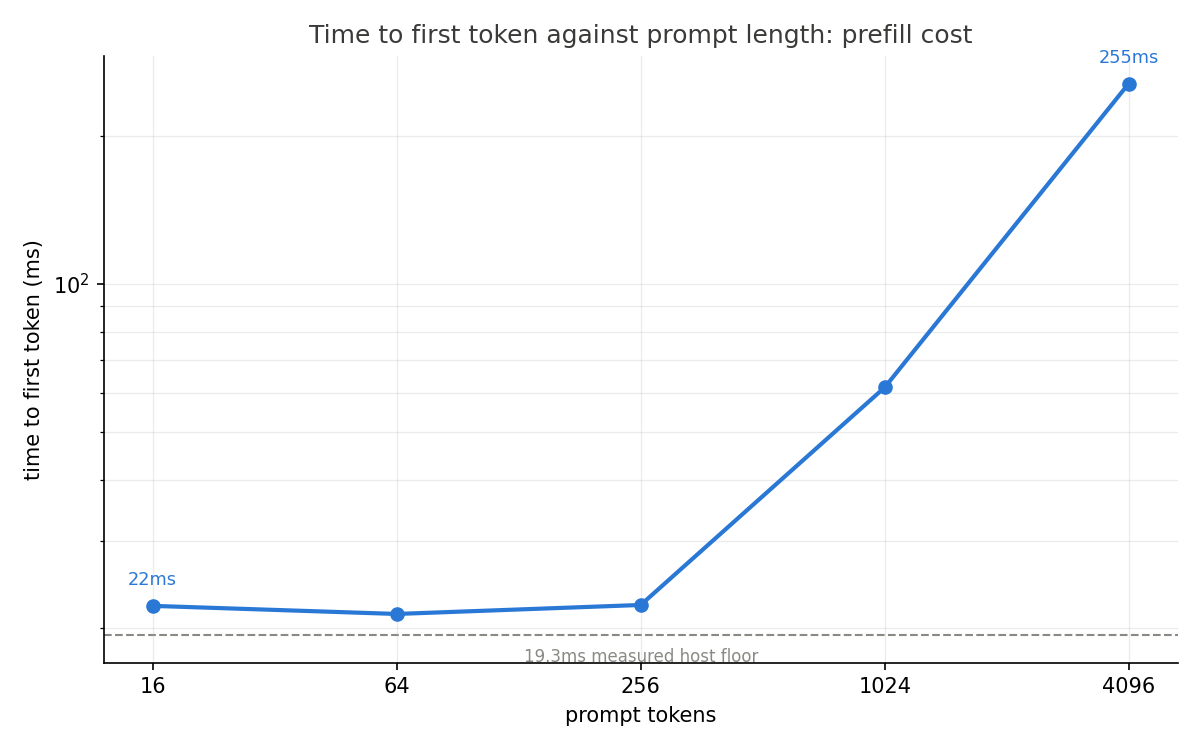
Prefill cost against prompt length. Flat across a 16x change in arithmetic, then linear once the work is large enough to outgrow the floor.
99.6% of the arithmetic is recomputation
At p4096 this engine performs those 1,081,216 token forwards to emit 256
tokens. An engine that held on to its intermediate results would need
4096 + 256 = 4,352: one pass over the prompt, then one token per step.
That is a 248x difference, so 99.6% of the work is recomputation.
The intermediate results are a key and a value vector, produced by every token in every layer. Attention works by having each token compare itself against the keys of the tokens before it, then take a weighted sum of their values. No position ever attends forward to a later one, so once a token's key and value are computed they can never change again. This engine throws them away at the end of every step and derives them again, 255 more times.
Caveats
One GPU, one model, one seed, batch size 1 throughout. Nothing here says anything about how this engine behaves under concurrency, which is the setting that actually matters for serving, and the whole redundancy argument gets more complicated once several sequences share a batch.
Measuring latency per token means waiting for the GPU to drain after every token. In principle that inflates every result here, by stopping the CPU from running ahead. It costs 0.23 ms per pass.
At short prompts there is nothing to overlap in the first place: the CPU is the bottleneck, so the GPU is already idle and making it wait costs nothing. At 4096 tokens the timings agree again for the opposite reason, because 249 ms of GPU work makes the wait invisible.
Bottleneck, and what follows
Capacity is not the constraint and never comes close to being one. Peak allocated memory moves from 2.90 GiB at p16 to 3.16 GiB at p4096 against 2.88 GiB of weights, so everything above the weights is transient and nothing persists between steps. That is precisely the trade this engine makes: it spends compute to avoid holding state, and 19 GiB of the card sits unused while it does.
The binding constraint is redundant computation. Not bandwidth, not capacity, not kernel quality. The arithmetic being performed is arithmetic that does not need to happen at all.
Removing it is the next change. Behind it sits a second constraint that this part already measured: 1,123 GPU instructions at 16.5 µs each is 18.5 ms of pure host cost, against the 5.15 ms of memory traffic a cached decode step would actually need. At p16 this engine spends 21.9 ms per step, so that 18.5 ms of host cost is 85% of the step.
The standard fix for host cost is to capture the sequence of GPU instructions once and replay it as a single submission. It needs static shapes, and this engine's input grows every step, from 16 tokens wide to 271. A cache makes every decode step exactly one token wide, so the cache is a prerequisite rather than an alternative, and that is the reason it comes next.
Prediction
A cached step has about 5.15 ms of GPU work against a 19.32 ms host floor. Step time is the larger of the two, since the CPU runs ahead of the GPU, so the cache should land at 19.3 ms per step, about 52 tok/s, flat across every prompt length, and not at the 194 tok/s the bandwidth alone would allow.
| prompt | naive | predicted cached | predicted speedup |
|---|---|---|---|
| p16 | 45.66 tok/s | ~52 | ~1.1x |
| p64 | 45.22 tok/s | ~52 | ~1.2x |
| p256 | 35.08 tok/s | ~52 | ~1.5x |
| p1024 | 13.69 tok/s | ~52 | ~3.8x |
| p4096 | 3.60 tok/s | ~52 | ~14x |
The cache will buy essentially nothing at short prompts. This engine already runs at 21.9 ms per step at p16, only 13% above the floor. It is sitting on that floor, not on a compute limit, and deleting redundant compute cannot help where compute was never the constraint. The cache pays only once the recomputation it removes is large enough to have been the binding cost, which happens somewhere between p256 and p1024.
If that holds, the bottleneck moves from redundant computation to per step host overhead, and removing that overhead is worth more at short prompts than the cache is.
Reproducing this
uv run modal run modal_app.py::main --engine naive
uv run modal run scripts/measure_overhead.py::main
Defaults are the recorded configuration: five runs, two warmup, 256 new tokens,
seed 0, batch size 1, all five prompts. Engine flags for this baseline are
kv_cache=false and logits_to_keep=1.