A KV cache
infer/engines/cachedContents
Part 1 kept nothing between steps, so every step ran the model over the whole sequence built so far and rederived what the earlier steps had already worked out. At a 4096 token prompt that cost 1,081,216 token forwards to emit 256 tokens, and throughput fell from 45.66 tokens/s at a 16 token prompt to 3.60 at a 4096 token one. This part keeps those intermediate results instead.
Decode goes flat: 44.05 to 46.21 tokens/s across a 256x range of prompt lengths. At a 4096 token prompt that is a 12.73x speedup over Part 1. At a 16 token prompt it is 0.96x, 3.5% slower, because the cache costs more than it saves there.
The GPU has data to move for 5.2 ms of every 22 ms step and sits idle for the other 76%, waiting on the CPU.
What a cache is, and what changed
Attention is causal, so no token ever attends to a token that comes after it. Each token produces a key vector and a value vector in every layer of the model. Later tokens compare themselves against those keys and take a weighted sum of those values.
Because attention only ever looks backwards, a token's key and value are fixed the moment it is produced, and every later step reads back exactly the same numbers. Part 1 recomputed them from scratch 255 times. This engine keeps them, which is what a KV cache is.
The change is one buffer per layer, allocated once at the full size the run will need, holding one key and one value per position.
The two halves of the loop use it differently, and they are measured
separately throughout. Prefill is the first pass, the one over the prompt.
It fills the first P slots, and its cost is reported as time to first token,
the wait before anything appears. Every pass after it is a decode step,
which writes one more slot and reads the rest, so it feeds a single token into
the model instead of the entire sequence. Its cost is reported as inter token
latency, the gap between one token and the next, and tokens/s is that
gap inverted.
Nothing else moved: same model, same precision, same GPU, same prompts, same sampling, same seed, same run counts.
Setup: Qwen2.5-1.5B in fp16, one NVIDIA A10, greedy decoding from seed 0, 256 new tokens per run, five recorded runs after two warmup runs, batch size 1.
What I expected
Part 1 ended with this:
A cached step has about 5.15 ms of GPU work against a 19.32 ms host floor. Step time is the larger of the two, since the CPU runs ahead of the GPU, so the cache should land at 19.3 ms per step, about 52 tok/s, flat across every prompt length, and not at the 194 tok/s the bandwidth alone would allow.
The prediction made two claims. It called decode flat across every prompt length, and decode is flat. It called the rate 52 tok/s, and the measurement is 44.05 to 46.21, low by 12 to 15% at every prompt length.
| prompt | predicted | measured |
|---|---|---|
| p16 | ~52 tok/s | 44.05 |
| p64 | ~52 | 45.70 |
| p256 | ~52 | 46.21 |
| p1024 | ~52 | 45.67 |
| p4096 | ~52 | 45.80 |
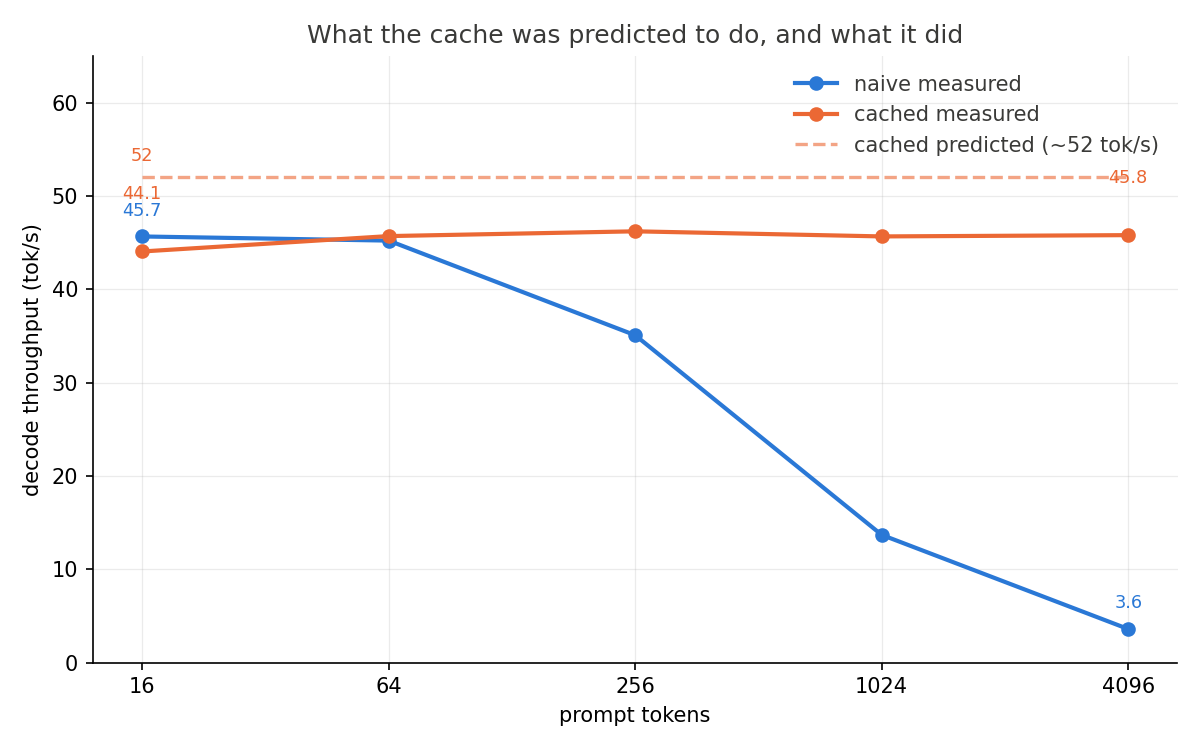
The dashed line is the prediction, flat at 52 tok/s. The measured line is flat too, and sits under it at every prompt length. Missing by the same amount everywhere means one wrong term accounts for all of it, which is the subject of a section below.
Results
| prompt | prompt tokens | TTFT | total | decode | per token | ITL p95 | peak memory |
|---|---|---|---|---|---|---|---|
| p16 | 16 | 34.0 ms | 5.821 s | 44.05 tok/s | 22.7 ms | 24.0 ms | 2.89 GiB |
| p64 | 64 | 27.0 ms | 5.606 s | 45.70 tok/s | 21.9 ms | 22.3 ms | 2.90 GiB |
| p256 | 256 | 25.1 ms | 5.543 s | 46.21 tok/s | 21.6 ms | 23.0 ms | 2.91 GiB |
| p1024 | 1024 | 55.2 ms | 5.639 s | 45.67 tok/s | 21.9 ms | 22.4 ms | 2.98 GiB |
| p4096 | 4096 | 247.7 ms | 5.815 s | 45.80 tok/s | 21.8 ms | 22.3 ms | 3.25 GiB |
TTFT is time to first token and ITL is inter token latency. Same
conventions as Part 1: totals are means, latencies are medians, decode
throughput excludes prefill, and run to run spread is about 1.0% at p4096
against Part 1's 0.08% because the run is twelve times shorter.
| prompt | Part 1 | Part 2 | speedup |
|---|---|---|---|
| p16 | 45.66 | 44.05 | 0.96x |
| p64 | 45.22 | 45.70 | 1.01x |
| p256 | 35.08 | 46.21 | 1.32x |
| p1024 | 13.69 | 45.67 | 3.34x |
| p4096 | 3.60 | 45.80 | 12.73x |
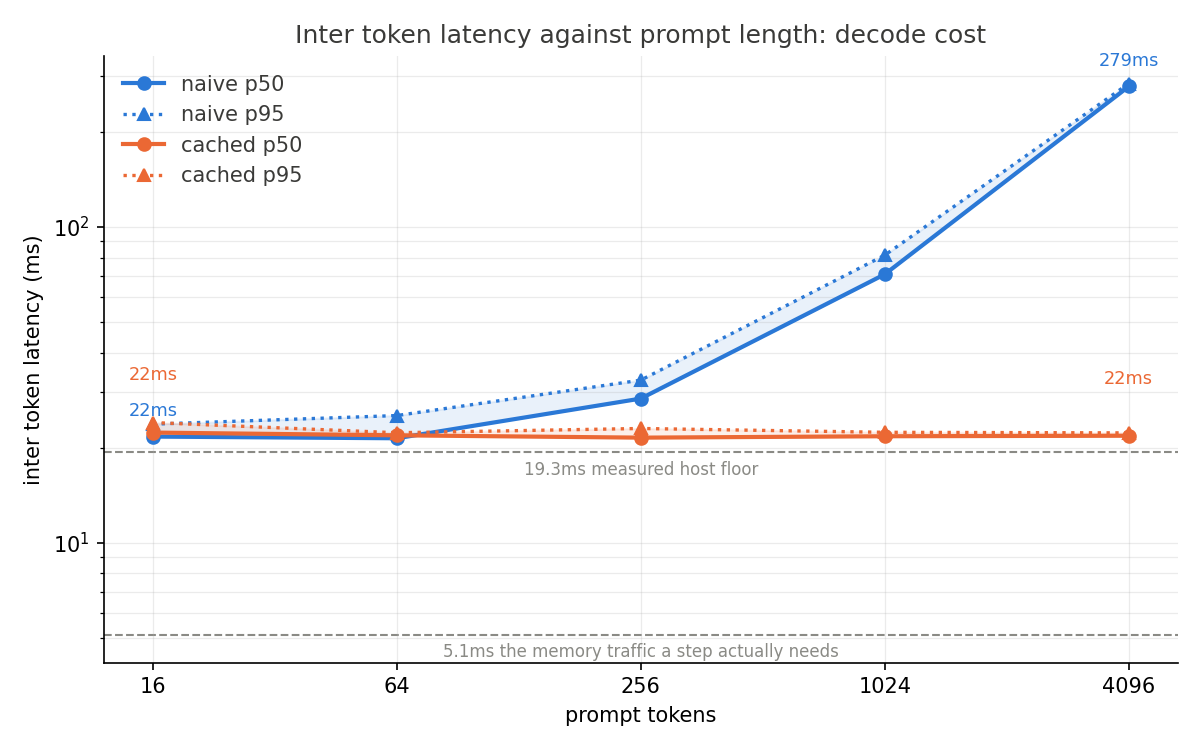
Part 1 rises with the prompt because each of its steps reprocesses the whole sequence. Part 2 is flat at about 22 ms. The dashed lines are the two controls from Part 1: the 5.15 ms of memory traffic a decode step needs, and the 19.32 ms a forward pass costs before the GPU does anything useful. This engine sits just above the upper one at every prompt length.
Decode is flat because a decode step no longer depends on how long the prompt is. Part 1 fed the whole sequence back in every step, so a step at a 4096 token prompt put 4096 tokens through the model and a step at a 16 token prompt put through 16. This engine puts one token through either way and reads the rest out of the cache. The prompt is still paid for once, in prefill, which is the TTFT column and still rises from 34.0 ms to 247.7 ms.
Both engines produce the same 256 tokens at all five prompt lengths. That is identity of tokens under a greedy choice, not identity of the numbers behind them. Attention runs over the full square in Part 1 and over a single row here, so the two almost certainly differ in the last few decimal places. They never differ enough to change which token wins.
Decode is what the cache changed, so decode is what the rest of this part is about.
Why the floor did not carry
The wrong term in the prediction is the floor itself. Part 1 measured 19.32 ms as what one forward pass costs before the GPU does any useful work, on a pass with no cache attached, and this engine does not run that pass.
Holding a cache adds work to every forward, and all of it lands on the host, the CPU side of the program, rather than the GPU. Each of the 28 layers now writes a key and a value into the buffer, and each one is routed through the cache to do it. Every step also reads back how long the sequence is, so that positional encoding lands in the right place, and asks the cache for the sizes the attention mask needs. None of that existed in the pass the floor was measured on.
Where a decode step actually goes
Every decode step reads the weights once, 3.09 GB, plus the cache in full, which runs from 7.8 MB at p16 to 125 MB at p4096. Against 600 GB/s that is 5.15 ms of traffic at the shortest prompt and 5.36 ms at the longest, inside a step of about 22 ms either way.
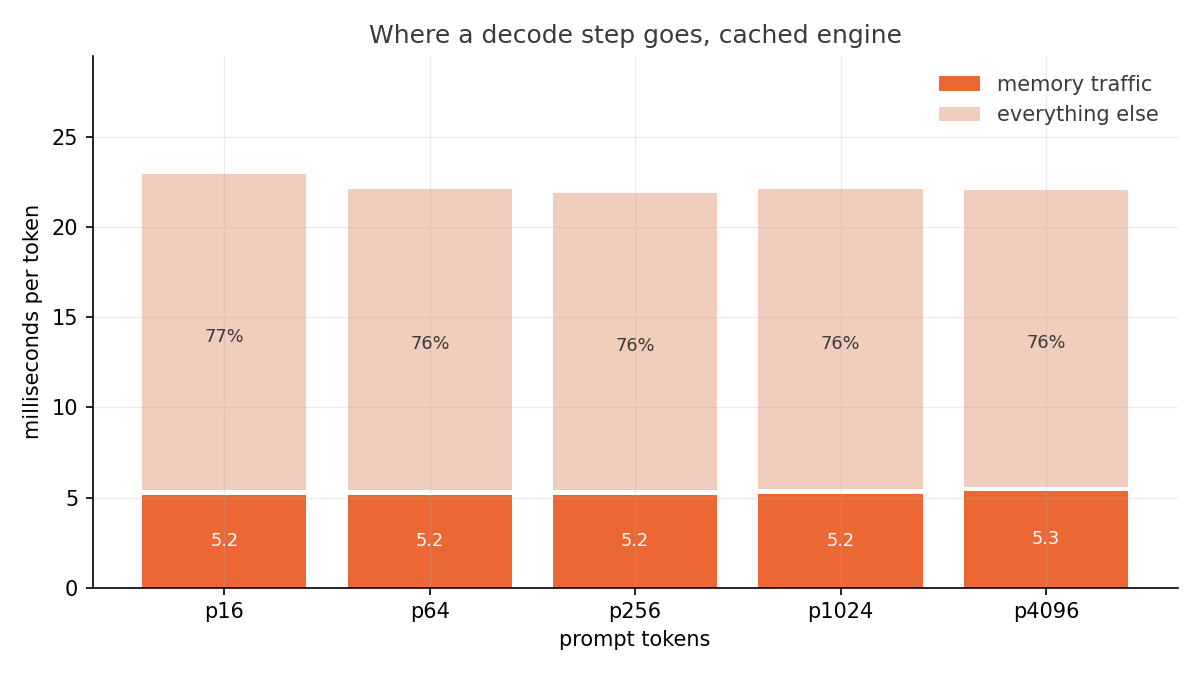
About 76% of every step is the GPU waiting for the host to hand it the next instruction. It is not waiting for memory and it is not computing. A single token needs almost no arithmetic, and the traffic it does need takes 5.2 ms of the 22.
The same fraction appears from two directions. 5.15 ms of weight traffic inside a 21.8 ms step is 23.6%, and 45.80 tok/s against the 194 tok/s ceiling the bandwidth allows is also 23.6%. They are one quotient computed twice.
At p16 both engines are held up by the host and both move the same weights, which is why the cache buys nothing there.
Caveats
Still one GPU, one model, one seed, batch size 1. Nothing here says anything about behaviour under concurrency, which is the only setting where an idle GPU actually matters.
Still no production engine measured on the same card. Every ceiling in this part is derived from the hardware's specification instead.
The byte accounting is derived, not observed. It assumes the weights are read exactly once per pass and the cache is read in full every decode step. Nothing here watches actual DRAM traffic.
The floor for this engine was never measured directly. The 2.3 to 3.4 ms above the old floor is attributed to cache bookkeeping on the strength of what that bookkeeping consists of, not on a measurement of it. Running the single token forward pass again with a cache attached, and timing the pieces separately, would say whether the bookkeeping accounts for the whole gap or only part of it.
Prefill was supposed to be a control and it failed. It is the same operation in both engines, so time to first token should not have moved. It moved in both directions:
| prompt | Part 1 | Part 2 | delta |
|---|---|---|---|
| p16 | 22.1 ms | 34.0 ms | +11.9 |
| p64 | 21.3 ms | 27.0 ms | +5.7 |
| p256 | 22.2 ms | 25.1 ms | +2.9 |
| p1024 | 61.6 ms | 55.2 ms | -6.4 |
| p4096 | 255.5 ms | 247.7 ms | -7.8 |
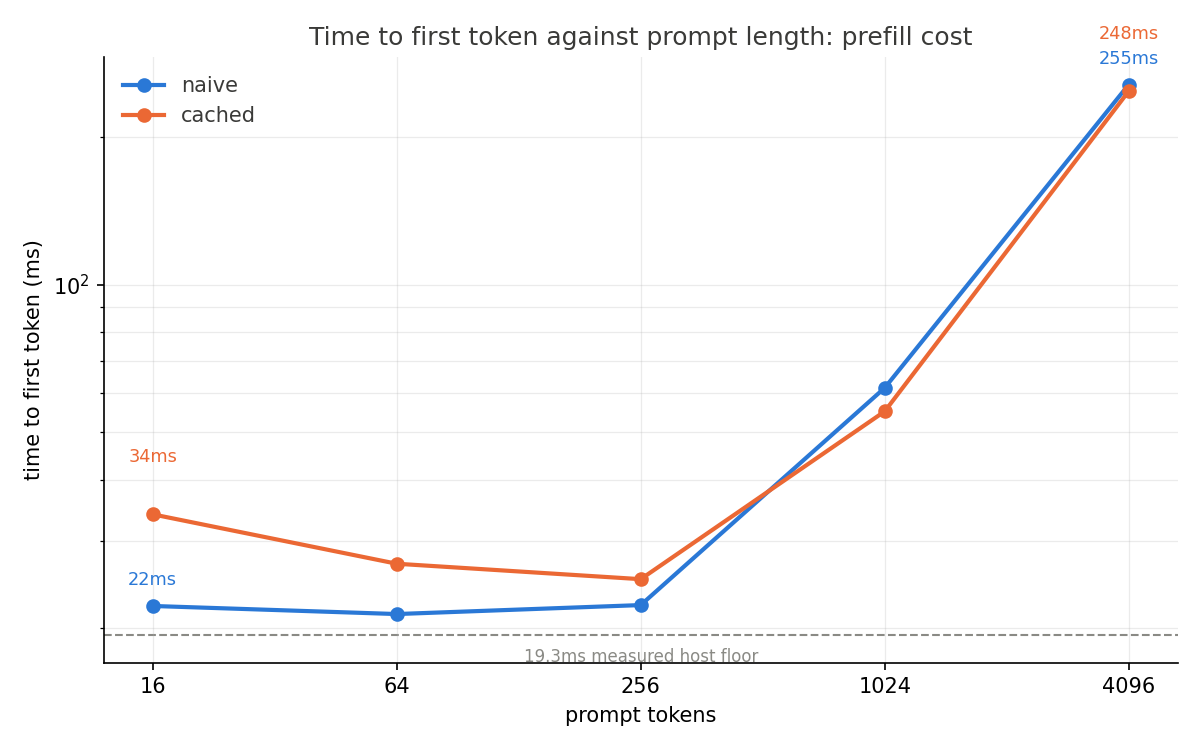
The five run distributions do not overlap in either direction. At p4096 Part 1 spans 254.2 to 256.5 ms against 246.5 to 248.2 ms here, so neither sign is noise.
The short prompt end fits a fixed setup cost, exposed when prefill has almost no GPU work to hide it behind. The long prompt end needs a second effect of the opposite sign, and the two engines did run a day apart on separately rented cards. Running both back to back in one container would settle it. I have not done that.
Peak memory is the other thing I cannot account for. This engine sits 16 to 18 MiB below what the cache size alone predicts, at all five prompt lengths, where an explanation based on the intermediate values Part 1 materialized predicts a residual that grows with the sequence. None of these three changes any conclusion in this part, and all of them get more expensive to chase the longer they are left.
Bottleneck, and what follows
The binding constraint is per step host overhead, and it now applies at every prompt length. In Part 1 it applied only at short ones. Part 1 predicted this handoff and it happened.
Capacity is under no pressure at all: even at p4096 the cache is 119 MiB against roughly 19 GiB free.
Batching is the way to use idle time that is idle for host reasons. The host
cost is charged per forward pass, not per sequence, so running B sequences
through one pass should produce B tokens for roughly the same 22 ms.
Aggregate throughput should scale with B until the extra cache traffic uses
up the bandwidth going spare.
Prediction
Step time should stay near 22 ms as batch size grows, because the 1,123 GPU
instructions per pass do not multiply with the number of sequences going
through it. Aggregate throughput should be roughly B x 45.5 tok/s, close to
linear.
It should stop being linear when the memory traffic per step catches up with the 22 ms budget. At 600 GB/s a 22 ms step can move 13.2 GB. The weights take 3.09 GB of that, leaving about 10.1 GB for the cache, which is roughly 353,000 token positions at 28 KiB each. That is the limit, and at 512 token sequences it is around batch 690.
Capacity would not bind before that.
Reproducing this
uv run modal run modal_app.py::main --engine cached
uv run python scripts/roofline.py
uv run python scripts/analyze.py --parity naive cached
Defaults are the recorded configuration: five runs, two warmup, 256 new tokens,
seed 0, batch size 1, all five prompts. Engine flags: kv_cache=true,
logits_to_keep=1, attn=sdpa, cache_layout=preallocated_contiguous.
The byte accounting comes from scripts/roofline.py, whose --check mode
asserts the formulas still reproduce every value published in the
derivation, so they cannot drift silently
underneath the analyses.