Against vLLM
servingContents
Eight parts built an inference engine one idea at a time, from a decode loop with no cache to one that sustains 5.68 requests per second. This part puts Part 7's engine and Part 8's engine against vLLM. Part 7's engine serves 3.99 requests per second against vLLM's 9.33, which is 43%, and Part 8's engine serves 4.79, which is 51%. Both numbers are upper bounds, because vLLM was still getting faster at the highest arrival rate it was given and 9.33 is therefore a floor on its capacity. One of the 11,620 requests failed.
How the comparison is set up
Three servers run one at a time, each alone on an A10. Two of them are my engines from Parts 7 and 8, in the configuration those parts published: 32 batch rows, a 512 token prompt chunk budget, and no ceiling on the memory pool. The third is vLLM running its own server, the one it ships.
vLLM keeps its defaults. Three things are set: half precision, a maximum sequence length of 4,352, and prefix caching turned off. That length is the longest prompt here plus the largest generation budget. Everything else it does by default it still does, including replaying recorded GPU operations and splitting long prompts across steps. Prefix caching is the one thing disabled, because these engines have no such cache, and leaving it on would let vLLM answer some requests out of a store the other side does not have.
My engines run behind an HTTP server I wrote. It refuses anything past 512 accepted and unfinished requests, a limit nothing here reached.
Both sides are given the same work: 400 arrivals per rate on a seeded schedule, prompts at five lengths from 16 to 4,096 tokens, and generation budgets from 64 to 256, which is the workload every earlier part used. Decoding is greedy and the end of sequence token is ignored, so every request generates its whole budget.
Those runs send each request at its scheduled time whether or not the server is keeping up. A second set of runs instead holds a fixed number of requests in flight, 1, 8, 32, and 128, starting a new one only when an old one finishes.
Served rate is requests completed over the time from the first arrival to the last completion. Time to first token and latency are measured from when a request was scheduled to arrive rather than when the client sent it, and those two moments differed by under a millisecond at the 99th percentile.
Results
Served requests per second, 400 requests per rate:
| arrival rate | Part 7 engine | Part 8 engine | vLLM |
|---|---|---|---|
| 2 | 1.85 | 1.86 | 1.88 |
| 3 | 2.71 | 2.74 | not run |
| 4 | 3.53 | 3.59 | 3.71 |
| 5 | 3.81 | 4.39 | not run |
| 6 | 3.83 | 4.69 | 5.47 |
| 7 | 3.90 | 4.79 | not run |
| 8 | 3.99 | 4.64 | 7.13 |
| 10 | not run | not run | 8.46 |
| 12 | not run | not run | 8.97 |
| 14 | not run | not run | 9.02 |
| 16 | not run | not run | 9.33 |
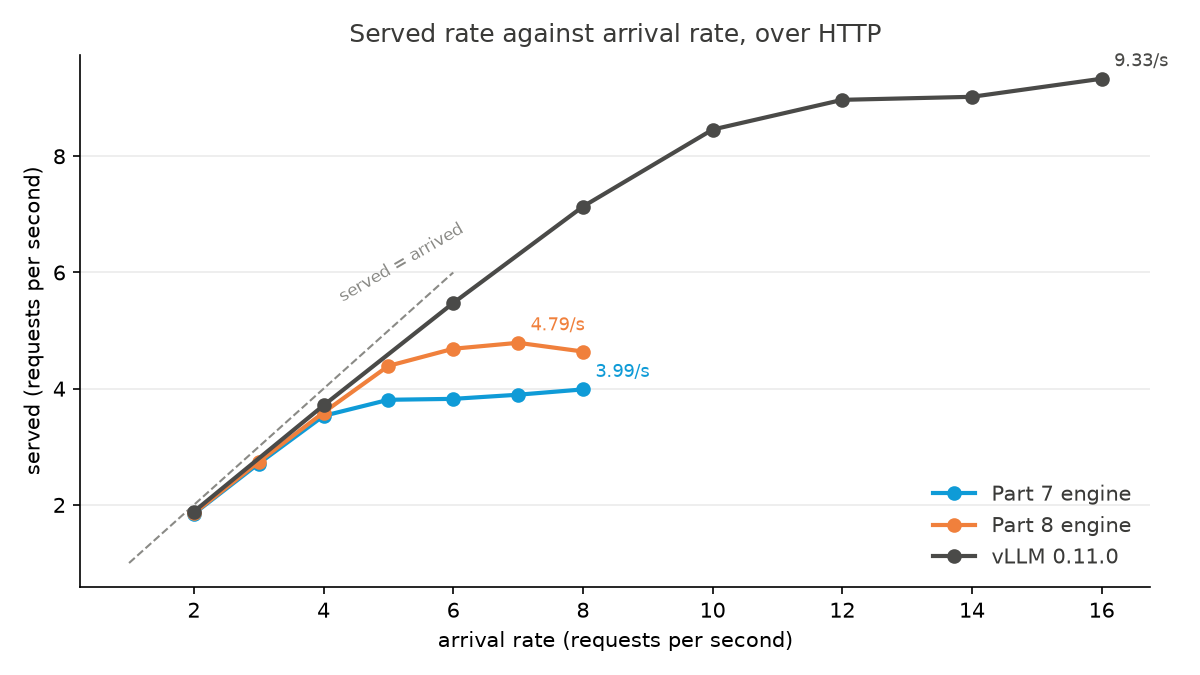
Part 8's engine caps out at 4.79 at 7 arrivals per second and 4.64 at 8, so 4.79 is its capacity. Part 7's engine flattens instead of turning over. It gains 0.18 from 5 arrivals per second to 8, so 3.99 is its capacity to within that. vLLM gains 0.36 over its last three arrival rates and is still climbing at 16.
Serving over HTTP costs each engine part of what it does in process. Part 7 goes from 4.53 requests per second to 3.99, a 12% drop, and Part 8 from 5.68 to 4.79, a 16% drop.
Median time to first token, and median total latency, by arrival rate:
| arrival rate | Part 7 first token | Part 8 first token | vLLM first token | Part 7 total | Part 8 total | vLLM total |
|---|---|---|---|---|---|---|
| 2 | 0.28 s | 0.39 s | 0.69 s | 5.32 s | 4.63 s | 2.45 s |
| 4 | 0.47 s | 0.43 s | 0.69 s | 7.65 s | 5.46 s | 2.74 s |
| 6 | 12.64 s | 4.41 s | 0.77 s | 19.30 s | 10.42 s | 3.37 s |
| 8 | 19.68 s | 14.16 s | 0.88 s | 26.95 s | 19.95 s | 4.34 s |
| 16 | not run | not run | 6.19 s | not run | not run | 15.95 s |
Closed loop, a fixed number of requests in flight, generated tokens per second:
| requests in flight | Part 7 engine | Part 8 engine | vLLM |
|---|---|---|---|
| 1 | 33 | 36 | 75 |
| 8 | 220 | 242 | 461 |
| 32 | 639 | 711 | 1,099 |
| 128 | 640 | 756 | 1,501 |
Why all three are the same below 4 arrivals per second
At 2 arrivals per second the three servers serve 1.85 to 1.88 requests per second. At 4 they serve 3.53 to 3.71. The difference only appears once my engines stop keeping up, at about 5 arrivals per second for Part 7's and 6 for Part 8's.
Below saturation every request is served as it arrives, so the served rate is the arrival rate. That says only that the arrival rate is under the engine's capacity. So the comparison is about where those three ceilings are: 3.99 for Part 7, 4.79 for Part 8, and at least 9.33 for vLLM.
Capacity is not the only thing that differs, and the closed loop runs measure the rest.
Why vLLM is about twice as fast
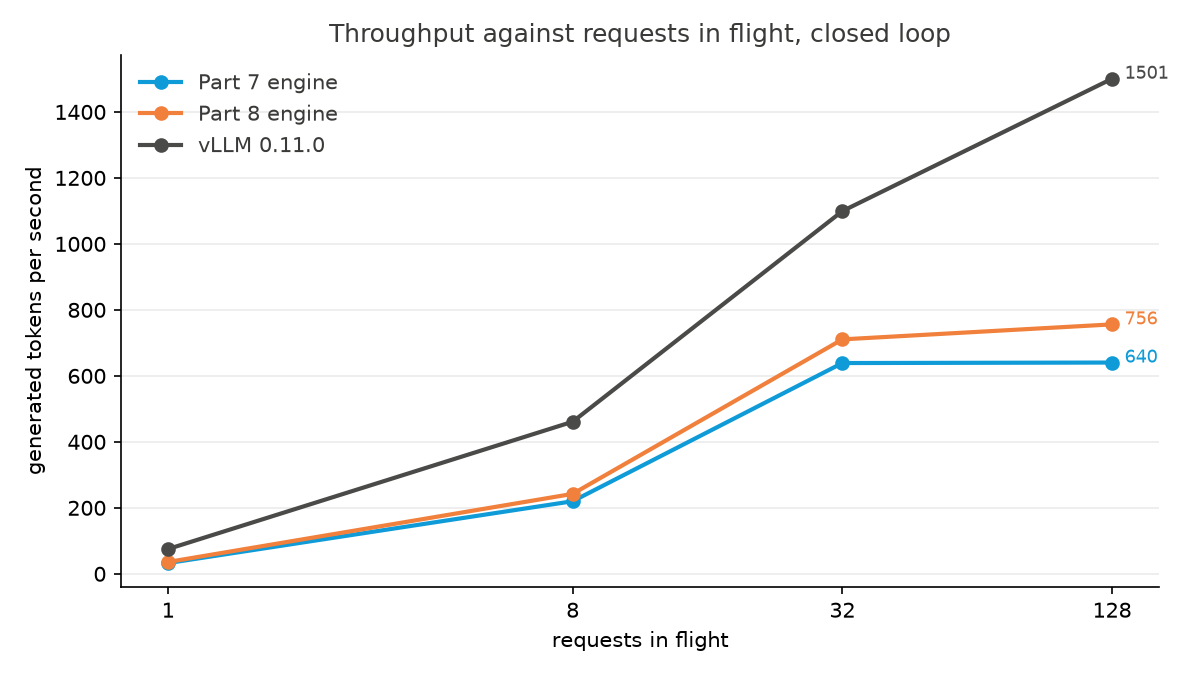
Generating one request at a time, vLLM produces 75 tokens per second against Part 8's 36. Nothing is batched at that point, so that ratio is the cost of running a single step. Part 8 measured where that time goes: a decode step of 24.0 ms, of which 5.15 ms is reading the weights, about 3 ms is attention, and about 16 ms is issuing hundreds of small operations to the GPU one at a time. vLLM records that sequence of operations once and replays it. This series never did, and the 16 ms is what that costs.
Batching pays a step's fixed cost once for the whole batch instead of once per request, so the more requests are in flight, the less that 16 ms matters. With 8 in flight vLLM is 1.90 times faster, and with 32 it is 1.55 times faster, which is the closest these engines come to it anywhere in this head to head.
Past 32 the difference grows again, to 1.99 times at 128 requests in flight. Part 7's engine goes from 639 tokens per second to 640 and Part 8's from 711 to 756, while vLLM goes from 1,099 to 1,501. These engines run at most 32 requests at once, so the other 96 wait rather than joining a batch. vLLM's own limit was never measured here, and all this head to head shows is that it is above 32, since vLLM turned those extra requests into tokens and the engines could not.
So the deficit has two causes. Most of it is the cost of executing a step, which is still 1.55 times at 32 requests in flight. The rest is the 32 row limit.
Why my engines start faster and finish slower
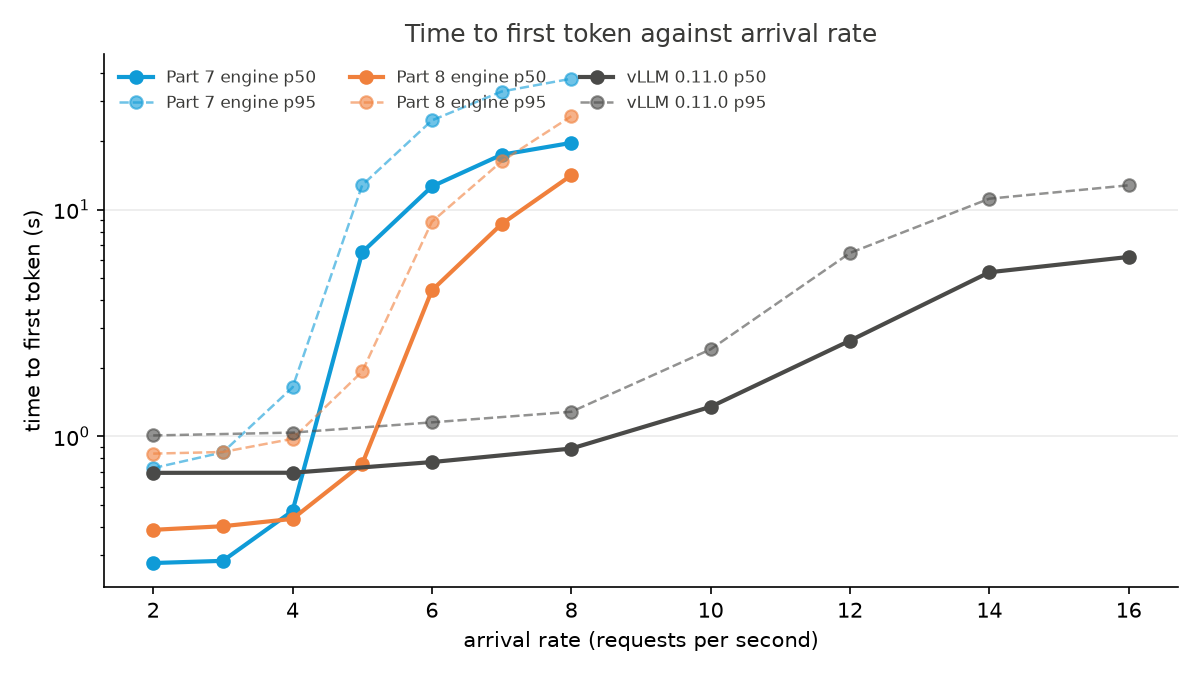
Below saturation my engines return a first token sooner than vLLM does. At 2 arrivals per second Part 7's takes 0.28 s and Part 8's 0.39 s against vLLM's 0.69 s, and vLLM stays near 0.7 s until it approaches its own ceiling. A lightly loaded engine here starts a new prompt on its next scheduling turn, and a turn is about 30 ms.
The same requests finish later. At that same rate the median request takes 5.32 s and 4.63 s end to end against vLLM's 2.45 s. Nothing is queueing at 2 arrivals per second, so that is the per token cost from the previous section showing up as latency: generating the same number of tokens at 36 per second against 75 takes about twice as long.
Both of those numbers come with the same caveat. The two servers are read through different interfaces. Mine reports a first token when the engine produces it, and vLLM's is counted when the text arrives. That difference lands in the first token number and not in the totals. The size of the first token advantage is therefore uncertain. The latency deficit is not, since it agrees with the one request at a time throughput measured separately.
Above saturation the first token advantage reverses. By 6 arrivals per second Part 7's engine takes 12.64 s to a first token against vLLM's 0.77 s. Once an engine is saturated, the wait in its queue is larger than everything else in the measurement combined.
Caveats
vLLM was still rising at the highest arrival rate it was given, 8.97 then 9.02 then 9.33, so 9.33 is a floor on its capacity and the two headline percentages are upper bounds on how close these engines get. Going past 16 arrivals per second until it turned over would have settled it and was not run.
Time to first token is read through two different interfaces, as described above, so no experiment here separates protocol cost from engine cost. Serving vLLM through an endpoint written the same way as mine would have settled it, and was not done. Served rate and tokens per second are unaffected, since both count whole requests and whole tokens over a span.
The load generator runs on a laptop and sends over the public internet, which adds a round trip to every request. It is the same round trip for all three servers and it was measured before each run, but it inflates every latency here compared to a client in the same datacenter.
Both engines ran at 32 batch rows with no pool ceiling. vLLM chose its own memory split and its own limits. This compares two published configurations, not two systems tuned equally hard, and the runs at 128 requests in flight are where that shows.
Each arrival rate ran once, on one container, from one seeded trace. If one container got a slower A10 than the others, it would show up as one slow arrival rate and nothing here would catch it.
Reproducing this
uv run python serving/test_serve_bridge.py
uv run modal deploy serving/modal_serve.py
uv run modal deploy serving/modal_vllm.py

for target in fused32 flash32 vllm:
  uv run python serving/loadtest.py --target $target --base-url <url> --mode smoke
  uv run python serving/loadtest.py --target $target --base-url <url> \
      --n-requests 400 --concurrency "" --out results/vllm/serving.csv
  uv run python serving/loadtest.py --target $target --base-url <url> \
      --rates skip --concurrency 1,8,32,128 --out results/vllm/serving.csv

uv run python serving/loadtest.py --target fused32 --base-url <url> --rates 8 \
    --n-requests 400 --concurrency "" --out results/vllm/serving.csv
uv run python serving/loadtest.py --target flash32 --base-url <url> --rates 8 \
    --n-requests 400 --concurrency "" --out results/vllm/serving.csv

uv run python scripts/plot_vllm.py
Greedy decoding, seed 0, Qwen2.5 1.5B in fp16, Modal A10, vLLM 0.11.0.
One row per request lands in results/vllm/serving.csv, and one
metadata file per run records the server's own description of itself,
the round trip time, and a check that nothing between the client and the
server was buffering the stream. The targets run one at a time, since
two runs at once would share the laptop's uplink and neither one's
arrival timing would be trustworthy. The rate 8 runs are listed
separately because they were added to push both engines past their
peaks.
Every percentile in this writeup is computed from that file rather than from the load generator's own summary lines, which were wrong while this head to head ran: the tool passed a fraction to a function expecting a percentage, so it printed roughly the minimum wherever it said p50, p95, or p99. The recorded rows were never affected and the fix is in the tool.