A library kernel for decode
infer/engines/flashContents
Part 7's engine runs one model forward per scheduling step and splits attention inside that forward, sending prompt chunks to one kernel and decode tokens to another. This part replaces the decode half with flash attention's paged cache kernel and changes nothing else about the engine. Sustained service rises from 4.53 to 5.68 requests per second, 25%, and the median pure decode step falls from 31.3 ms to 24.0 ms. Adopting the kernel also forces the memory pool's pages from 64 slots to 256.
What changed
A step is one turn of the engine's serving loop: it picks the work that runs now, runs the model on it, and retires whatever finished. A forward is one complete pass through the model's 28 layers. Each step carries two kinds of work. Prompt chunks are up to 512 prompt positions from requests that are still reading their prompt. Decode tokens are one token per request that has finished reading and is now generating. A pure decode step carries only the second kind, and a loaded step carries both.
The one thing this part changes is which kernel computes attention for the decode tokens. Everything else is inherited: the scheduler, strict first come first served admission, the memory pool, eviction, the 512 token chunk budget, the single forward per step, and the prompt chunk attention kernel.
The kernel being replaced gives each request one query row and runs those rows in parallel, one group of processors per request. With 32 requests decoding that is 32 groups, and each group walks its own request's whole cached history by itself. The library kernel divides the work the other way. It cuts each request's cached keys into slices, computes a partial attention result for every slice in parallel, and merges the partials, so one request's history is spread across many groups rather than sitting in one.
Adopting it forces one change on the engine. The kernel refuses a paged cache whose pages are narrower than 256 slots, and this engine's pages were 64, so the pool now hands out 256 slot pages. Space is reserved a whole page at a time when a request is admitted, so a request needing 300 slots now holds 512 where it used to hold 320. That waste costs nothing while the pool has room to spare, and it is the reason the capped pool control below is in the results.
Setup: Qwen2.5 1.5B in fp16 on a Modal A10, greedy decoding, seed 0. Closed runs hand the engine its whole batch at time zero and time the batch to completion, 5 recorded runs after 2 discarded warmup runs. Open runs deliver requests one at a time while the engine works, replaying 400 Poisson arrivals per rate from a fixed seed, with prompts drawn from a mix of 16, 64, 256, 1024, and 4096 token lengths and generation budgets from 64 to 256 tokens.
The library publishes no build for the PyTorch version Parts 1 through 7 ran on, so this engine runs on PyTorch 2.10 where Part 7 ran on 2.13. Part 7's engine was rerun unchanged on 2.10 to size what that difference is worth on its own, and it is a column in the step timing and served rate tables below.
What I expected
Part 7 recorded this prediction:
Cutting the per layer decode attention call from 0.347 ms to under 0.1 ms lands the pure decode step between 23 and 25 ms and the loaded step between 43 and 46 ms, and sustained service lands between 5.2 and 5.9 requests per second. If attention does not get faster, the served rate stays within noise of 4.53, since every other term in the step is untouched.
All three HELD. The pure decode step landed at 24.0 ms against the predicted 23 to 25, the loaded step at 43.9 ms against the predicted 43 to 46, and sustained service at 5.68 requests per second against the predicted 5.2 to 5.9.
I also recorded a doubt before building: the arrival sweep's requests carry a few hundred cached tokens rather than a few thousand, and at 517 cached tokens the old kernel already ran at 0.108 ms per layer, so the saving in the sweep looked like about 2 ms per step rather than 7. That doubt was WRONG. The decode step fell 6.3 ms, from 30.3 to 24.0 on the same engine and version. The workload draws prompts up to 4,096 tokens, and a step's attention cost is set by the requests with the longest histories, not by the median one.
Results
Per step timing on the disturbance workload, 64 mixed requests queued through 32 rows so admission happens continuously while incumbents decode. The instrumentation synchronizes around every forward and is identical across all four columns. The third column is this part's engine with this part's 256 slot pages, running Part 7's decode kernel, which separates the page size change from the kernel change.
| step kind | Part 7 engine | Part 7 engine on 2.10 | wide pages, old kernel | this part |
|---|---|---|---|---|
| pure decode step, p50 | 31.3 ms | 30.9 ms | 30.3 ms | 24.0 ms |
| loaded step, p50 | 51.5 ms | 52.9 ms | 51.9 ms | 43.9 ms |
| whole run, 500 steps | 19.0 s | 18.7 s | 18.4 s | 15.0 s |
| steps over 150 ms | 0 | 0 | 0 | 0 |
Reading across the decode step row, the PyTorch version is worth 0.4 ms, the wider pages another 0.6 ms, and the kernel the remaining 6.3 ms.
Open arrivals, 400 requests per rate, served rate and median queue wait:
| rate | Part 7 served | this part served | Part 7 queue p50 | this part queue p50 |
|---|---|---|---|---|
| 1 | 0.94/s | 0.94/s | 0.02 s | 0.01 s |
| 2 | 1.85/s | 1.87/s | 0.02 s | 0.01 s |
| 3 | 2.72/s | 2.75/s | 0.02 s | 0.01 s |
| 4 | 3.57/s | 3.61/s | 0.02 s | 0.02 s |
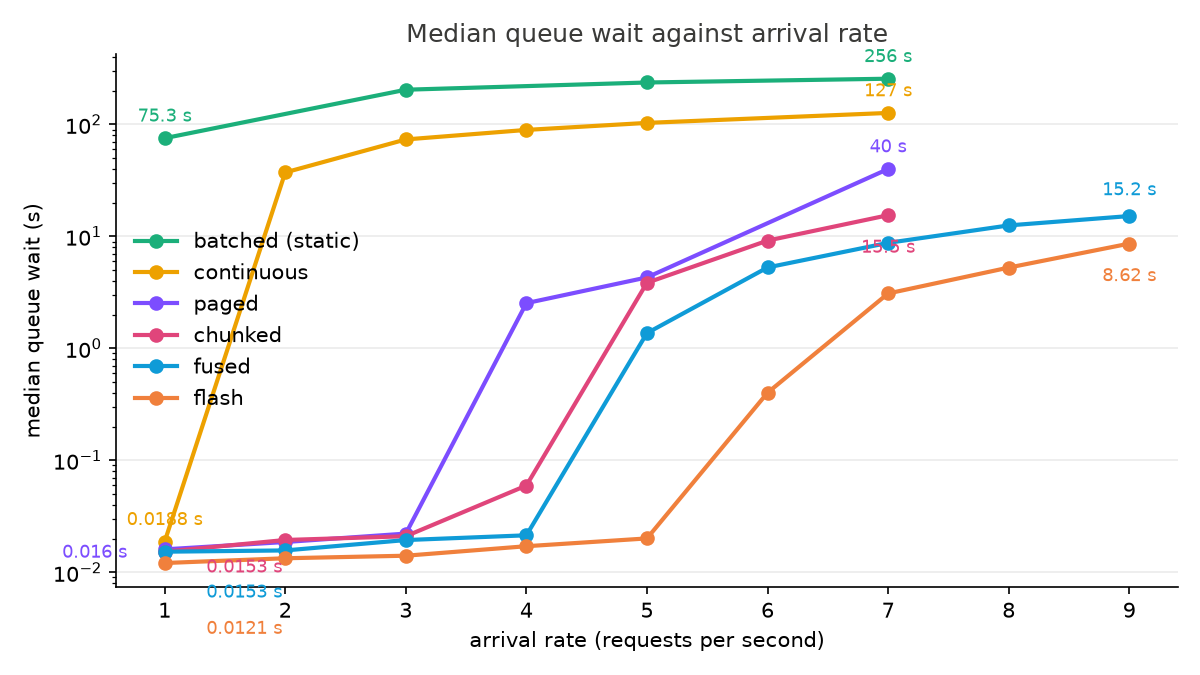
| 5 | 4.28/s | 4.45/s | 1.38 s | 0.02 s |
| 6 | 4.39/s | 5.24/s | 5.32 s | 0.40 s |
| 7 | 4.53/s | 5.42/s | 8.77 s | 3.10 s |
| 8 | 4.50/s | 5.68/s | 12.56 s | 5.27 s |
| 9 | 4.53/s | 5.49/s | 15.19 s | 8.65 s |
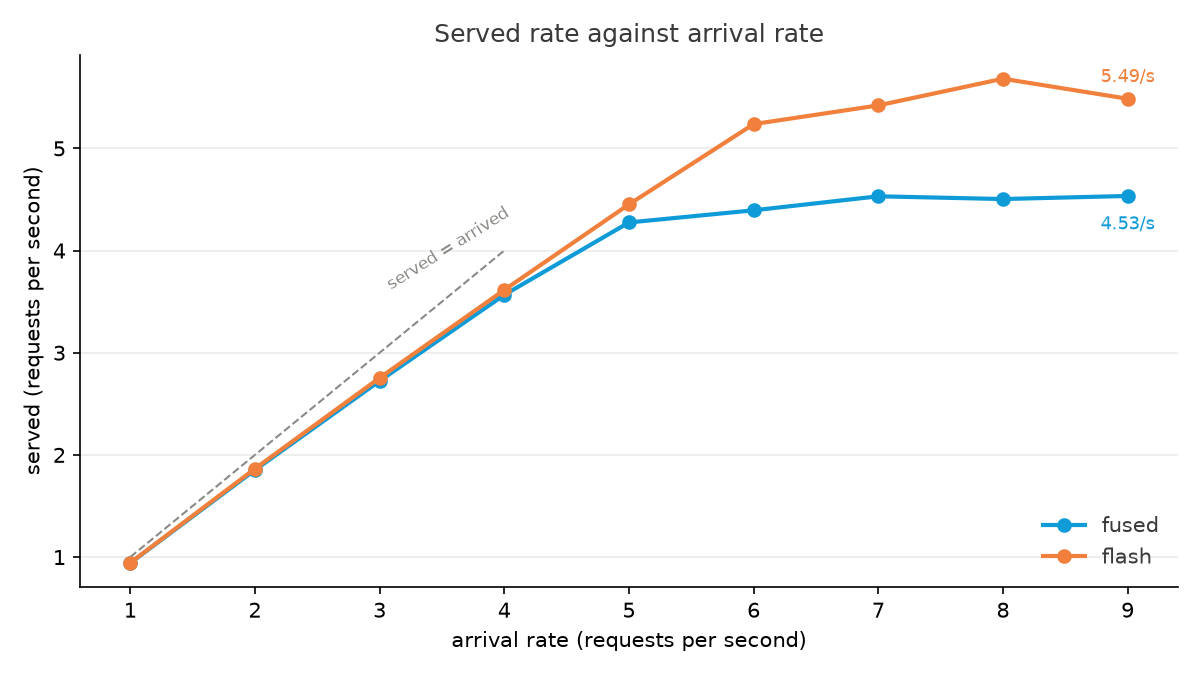
Service tops out at 5.68 per second at rate 8 and falls back to 5.49 at rate 9, so 5.68 is capacity rather than the last point on a curve still climbing. Below saturation the queue benefit is larger than the capacity gain: at rate 5 the median request waits 0.02 s against Part 7's 1.38 s, because this engine is not yet saturated at a rate where Part 7 already was.
That comparison spans two PyTorch versions, so both controls were swept as well:
| rate | Part 7 engine on 2.13 | Part 7 engine on 2.10 | wide pages, old kernel | this part |
|---|---|---|---|---|
| 5 | 4.28/s | not run | 4.28/s | 4.45/s |
| 6 | 4.39/s | 4.57/s | 4.44/s | 5.24/s |
| 7 | 4.53/s | not run | 4.62/s | 5.42/s |
The PyTorch version is worth 4% at rate 6, 4.39 to 4.57. The wider pages are worth nothing outside noise, 4.28 and 4.44 and 4.62 against Part 7's 4.28 and 4.39 and 4.53. The kernel is the rest: at rate 7, where engine and version and pages are all held fixed and only the kernel differs, service goes from 4.62 to 5.42, 17%.
Closed runs, median of 5, wall time for the whole batch:
| workload | Part 7 engine | this part | change |
|---|---|---|---|
| mixed batch 8 | 8.83 s | 6.75 s | 1.31x |
| mixed batch 32 | 12.03 s | 9.36 s | 1.29x |
| uniform 256 token batch 8 | 7.76 s | 6.11 s | 1.27x |
| uniform 256 token batch 32 | 8.51 s | 6.74 s | 1.26x |
| disturbance, 64 through 32 rows | 19.10 s | 15.48 s | 1.23x |
Part 7's engine ran the mixed batch of 32 again on 2.10 and finished in 11.36 s, so against a same version reference this part's 9.36 s is 1.21x.
Two of the numbers in that table are not the ones Part 7 published, and the reason is a mistake in Part 7 rather than a new measurement. Its uniform rows timed the batch to its last request, which is the wall time the column claimed. Its mixed rows timed the batch to its FIRST request, which finishes earlier because a mixed batch holds prompts from 16 to 4,096 tokens and they do not finish together. Recomputed to the last request throughout, Part 7's mixed batch of 8 is 8.83 s rather than 8.55 and its mixed batch of 32 is 12.03 s rather than 10.06. Every column in the table above uses the last request. Part 7 now carries a correction saying the same, because the mistake also inflated a claim it made about its own controls.
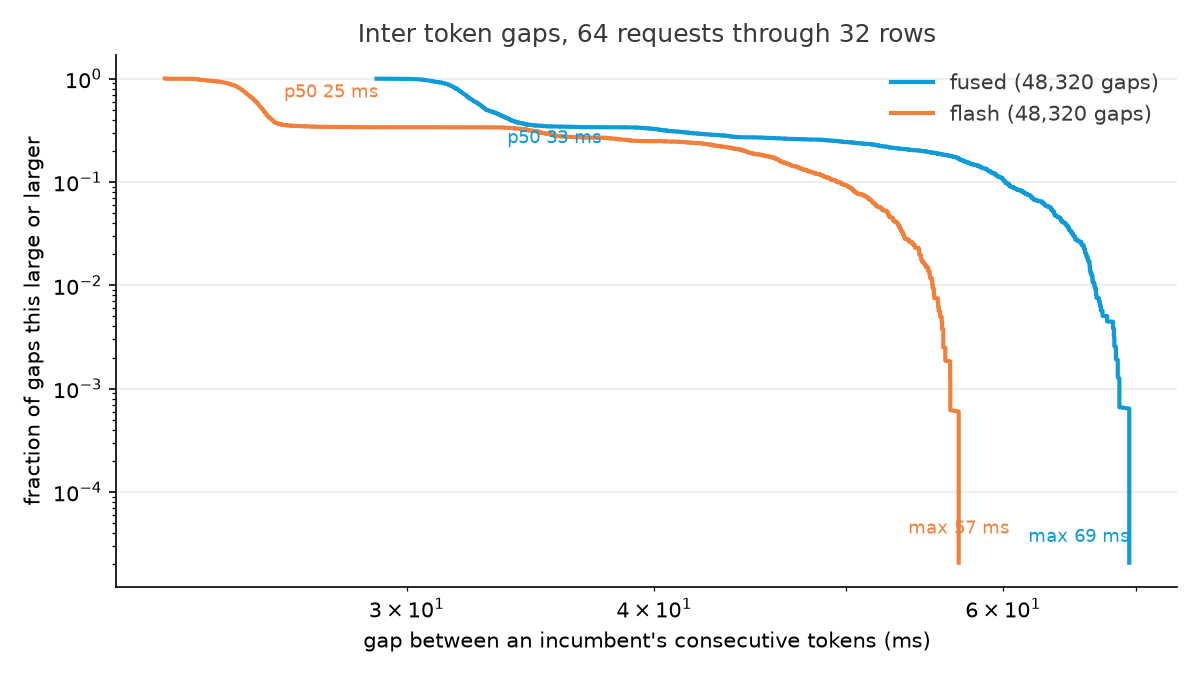
Consecutive token gaps for the incumbents on the disturbance workload, the wait between one token and the next for a request already generating:
| incumbent token gap | Part 7 engine | this part |
|---|---|---|
| median gap | 32.9 ms | 25.4 ms |
| 99th percentile gap | 66.7 ms | 55.3 ms |
| worst gap | 69.5 ms | 57.0 ms |
| gaps over 150 ms | 0 of 48,320 | 0 of 48,320 |
The pool capped at 0.5 GiB, the control that stresses admission rather than throughput, improved as well. At rate 2 both engines serve 1.85 and 1.87 per second. At rate 3 this part serves 2.74 against 2.53, 8% more, and the median queue wait falls from 7.63 s to 1.71 s.
Why the capped pool got better when its pages got coarser
I expected this control to be the place the page size change would show up as a loss, and it went the other way. The reasoning for the loss was sound as far as it went. Space is reserved for a request's whole generation when it is admitted, rounded up to a whole number of pages, so a request needing 300 slots takes 512 at 256 slot pages where it took 320 at 64 slot pages. Under a 0.5 GiB ceiling that really matters and it reduces how many requests fit at once.
What the reasoning left out is that the set of requests holding pages turns over. Each one finishes 23% sooner with the faster decode step, so its pages return to the free list sooner, and at rate 3 that outweighs the rounding. The evidence that both effects are present is in the two numbers: capacity rose only 8%, well under the 23% the step got faster, and the queue wait fell 4.5x, 7.63 s to 1.71 s, which is what a pool that turns over faster does to the requests waiting outside it.
Why 18% of the outputs changed
The tokens this engine produces are not identical to Part 7's. Across 520 requests that both engines ran under identical settings, 95 differ, 18%. Of the 125 requests with 4,096 token prompts, 75 differ. Of the 255 requests at 64, 256, and 1,024 tokens, none differ.
Two attention kernels that sum the same numbers in a different order give slightly different results in half precision, and when the top two candidate tokens are close enough, that difference decides which one wins. Everything after that point in the request is then a different sentence, so a single flipped token shows up as a completely different output. Longer prompts give more places for that to happen, which is where the concentration at 4,096 tokens comes from.
The gates that guard this compare every token against Part 7's engine and accept a flipped token only when the gap between the top two logits at that position is under 0.02, count each distinct flip site once, and cap how many are allowed. They pass, with one flip site. Separately the kernel itself was checked against a plain attention reference on a rebuilt cache and agrees to 1.95e-03, which is the identical figure Part 7's kernel scores on the same check, one unit in the last place at that output magnitude.
Caveats
The mixed batches and the arrival traces are one seeded sample each, shared with Parts 3 through 7. A draw with more or fewer 4,096 token prompts would change the attention cost per step, and this part's whole result is an attention cost, so that sensitivity matters more here than in earlier parts. It has not been measured.
The step timings come from a separate instrumented run that synchronizes around every forward, which adds about 5% to wall time. Those numbers compare across the four columns but not against the campaign runs.
The headline comparison, 4.53 to 5.68 requests per second, spans two PyTorch versions. The rerun bounds that at 4% and the page size control bounds the pages at nothing outside noise, but neither control was swept past rate 7, so the cleanest comparison at a fixed version in this writeup is at rate 7, 4.62 to 5.42, and not at the peak. Sweeping the control to rates 8 and 9 would have closed that and was not run.
The capped pool comparison is not like for like. Both engines were given 0.5 GiB, but a page is 64 slots in one and 256 in the other, so the two runs differ in reservation granularity as well as in kernel. The 8% figure is the combined effect and this writeup does not separate them.
Outputs are no longer identical to Part 7's, as described above. For a greedy decode the flipped requests are all near ties, but no independent check of output quality was run, and none of the differing outputs was read.
Reproducing this
uv run modal run modal_app.py::kernel_gate_flash
uv run modal run modal_app.py::gate_remote_flash --script gate_flash
uv run modal run modal_app.py::page256_probe
uv run modal run modal_app.py::kernel_bench

uv run modal run modal_app.py::step_trace_flash --engine-name flash
uv run modal run modal_app.py::step_trace_flash --engine-name flash --decode-kernel flex
uv run modal run modal_app.py::step_trace_flash --engine-name fused

uv run modal run modal_app.py::main --engine flash --mixed-seed 0 --batch-size 8,32 --max-batch 32 --chunk-tokens 512
uv run modal run modal_app.py::main --engine flash --prompts p256 --batch-size 8,32 --max-batch 32 --chunk-tokens 512
uv run modal run modal_app.py::main --engine flash --mixed-seed 0 --batch-size 64 --max-batch 32 --chunk-tokens 512
uv run modal run modal_app.py::main --engine fused --mixed-seed 0 --batch-size 32 --max-batch 32 --chunk-tokens 512 --flash-image-run

uv run modal run modal_app.py::arrivals --engine flash --rates 7 --n-requests 400 --max-batch 32 --chunk-tokens 512
   (repeat for rates 9, 8, 6, 5, 4, 3, 2, 1, one invocation per rate)
uv run modal run modal_app.py::arrivals --engine flash --rates 6 --n-requests 400 --max-batch 32 --chunk-tokens 512 --decode-kernel flex
   (repeat for rates 5 and 7)
uv run modal run modal_app.py::arrivals --engine fused --rates 6 --n-requests 400 --max-batch 32 --chunk-tokens 512 --flash-image-run
uv run modal run modal_app.py::arrivals --engine flash --rates 3 --n-requests 400 --max-batch 32 --chunk-tokens 512 --pool-gib 0.5
uv run modal run modal_app.py::arrivals --engine flash --rates 2 --n-requests 400 --max-batch 32 --chunk-tokens 512 --pool-gib 0.5

uv run python scripts/plot_arrivals.py --out results/flash/arrivals.png
uv run python scripts/plot_flash.py
uv run python scripts/parity.py fused flash
Greedy decoding, seed 0, Qwen2.5 1.5B fp16, Modal A10. Raw rows land in
results/flash/runs.csv, results/flash/runs.jsonl, and
results/flash/arrivals.csv. This part runs on PyTorch 2.10 with flash
attention 2.8.3, in a container image built for it, while Parts 1
through 7 keep the PyTorch 2.13 image they were measured on. The gates
run on the A10 through the second command and compare this engine token
for token against Part 7's, including the wide page admission and free
list checks, freed page poisoning under both attention backends, and a
gate that runs both decode kernels on the same pages and compares them.
The per layer kernel timings quoted above are kernel_bench and
page256_probe, and step_trace_flash prints the per step timing by
step kind.