Static batching
infer/engines/batchedContents
Part 2 ended with an engine that generates 45 tokens/s while the GPU sits idle for three quarters of every step. This part runs many requests through one forward pass instead of one at a time. 1,024 identical short requests that would take Part 2's engine 99.4 minutes one after another finish in 21.4 seconds, a 279x speedup. The speedup depends on prompt length and batch size. It is 279x at 16 prompt tokens and batch 1024, 141x at 256 prompt tokens and batch 512, and 13.5x at 4096 prompt tokens, where the card runs out of memory at batch 32.
Two results matter more than the headline. Throughput stops growing between batch 256 and 512 at every short prompt length, for a different reason than Part 2 predicted. The long prompts never reach that point, because a memory allocation nobody accounted for fails first. This is also the first part of the series where an optimization costs something. The same increase in batch size that raises throughput also raises time to first token.
What changed
A batch is a set of requests that go through the model together. Batch size, written B here, is how many. Parts 1 and 2 were all B=1: eight requests meant running the engine eight times. This engine stacks B token sequences into one [B, length] tensor, runs the same forward pass over it, and gets B next tokens per step instead of one.
The mechanism that makes this nearly free was measured in Part 2. A decode step there cost about 22 ms, of which roughly 17 ms was the CPU issuing 1,123 GPU instructions and only 5 ms was GPU work. That CPU cost is charged per forward pass, not per sequence. Running 8 sequences through one pass pays it once, so 8 tokens come out for roughly the price of one.
The batch is formed once and runs until its slowest member finishes. No request is added after the batch starts, and a row that finishes early keeps occupying its slot until the whole batch is done. Those two properties are what the engines after this one exist to remove, so they are measured here rather than patched.
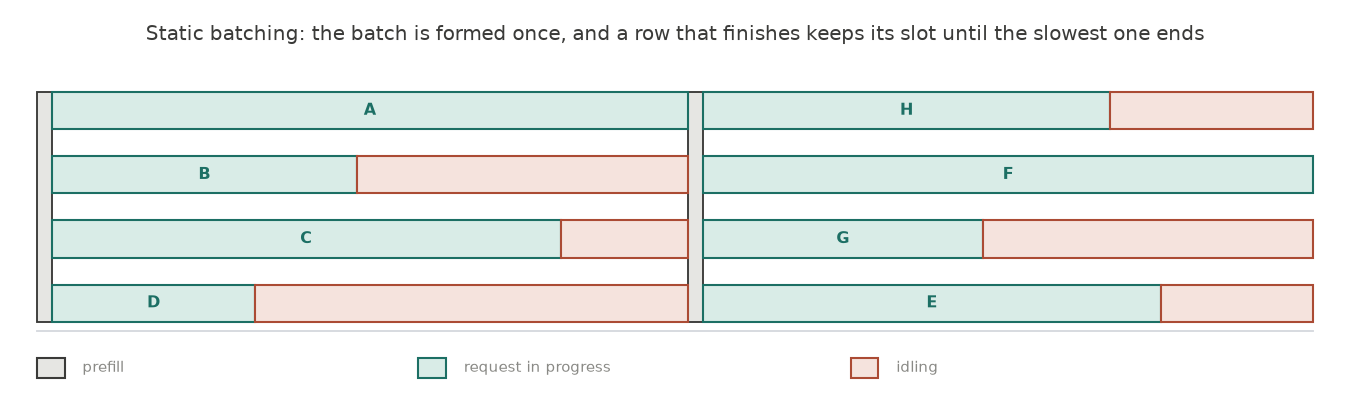
Eight requests through four slots, drawn to scale in decode steps. Green is a request in progress and red is a slot still running a forward pass for a request that has already finished. The batch does not re-form until every red block ends.
Two batch shapes are measured separately. A uniform batch replicates one prompt B times with one shared budget. Every row does identical work and the cache holds no empty space. A ragged batch draws mixed prompt lengths and mixed budgets. Shorter prompts are padded out to the length of the longest, and the model is told through a mask which positions are padding. Uniform measures what batching buys. Ragged measures what a realistic mix takes back.
Everything else is held where Parts 1 and 2 fixed it: Qwen2.5-1.5B in fp16, one Modal A10, the same five exact prompts of 16, 64, 256, 1024 and 4096 tokens, greedy decoding from seed 0, a 256 token budget, 2 warmup runs and 5 recorded runs per configuration. Before any of it ran, the batched engine's output was checked token for token against Part 2's engine for the same prompt and seed, at batch 1, in a uniform batch, and in a ragged batch. All three match exactly.
What I expected
Part 2 recorded this prediction:
Step time should stay near 22 ms as batch size grows, because the 1,123 GPU instructions per pass do not multiply with the number of sequences going through it. Aggregate throughput should be roughly
B x 45.5 tok/s, close to linear.It should stop being linear when the memory traffic per step catches up with the 22 ms budget. At 600 GB/s a 22 ms step can move 13.2 GB. The weights take 3.09 GB of that, leaving about 10.1 GB for the cache, which is roughly 353,000 token positions at 28 KiB each. That is the limit, and at 512 token sequences it is around batch 690.
Capacity would not bind before that.
Three claims. The first held. Measured aggregate decode throughput sits at 87
to 100% of B x 45.5 at every prompt length all the way to batch 256, with no
exception anywhere in that range. The second missed. Scaling stops between
batch 256 and 512, well before the predicted 353,000 cached positions, and the
thing that stops it is arithmetic, not memory traffic. The largest run in the
sweep holds 328,000 cached positions, and reading from GPU memory never comes
close to the card's 600 GB/s limit.
The highest rate measured anywhere in the sweep is 50% of that limit, at a
configuration that was still scaling when its next run failed for a different
reason.
The third claim failed outright. Memory capacity ran out first at three of the five prompt lengths, because the prediction counted weights and cache and forgot that prefill materializes activations. Both misses get their own sections below.
Results
For each prompt length, batch size doubles from 1 until either the full range to 1024 is covered or an allocation fails. The table below shows, for each prompt length, the largest batch size that ran and the last one before scaling broke. The curve for 256 token prompts is plotted below. Serial time is Part 2's published per request total multiplied by B.
| prompt | B | wall clock | serial | speedup | aggregate decode tok/s | % of B x 45.5 |
TTFT |
|---|---|---|---|---|---|---|---|
| p16 | 256 | 6.56 s | 24.8 min | 227x | 10,326 | 89% | 0.23 s |
| p16 | 1024 | 21.37 s | 99.4 min | 279x | 12,766 | 27% | 0.90 s |
| p64 | 256 | 7.30 s | 23.9 min | 197x | 10,153 | 87% | 0.87 s |
| p64 | 1024 | 24.82 s | 95.7 min | 231x | 12,262 | 26% | 3.52 s |
| p256 | 256 | 10.58 s | 23.6 min | 134x | 9,239 | 79% | 3.52 s |
| p256 | 512 | 20.06 s | 47.3 min | 141x | 10,127 | 43% | 7.16 s |
| p1024 | 128 | 13.72 s | 12.0 min | 53x | 5,063 | 87% | 7.26 s |
| p4096 | 32 | 13.75 s | 3.1 min | 13.5x | 1,393 | 96% | 7.87 s |
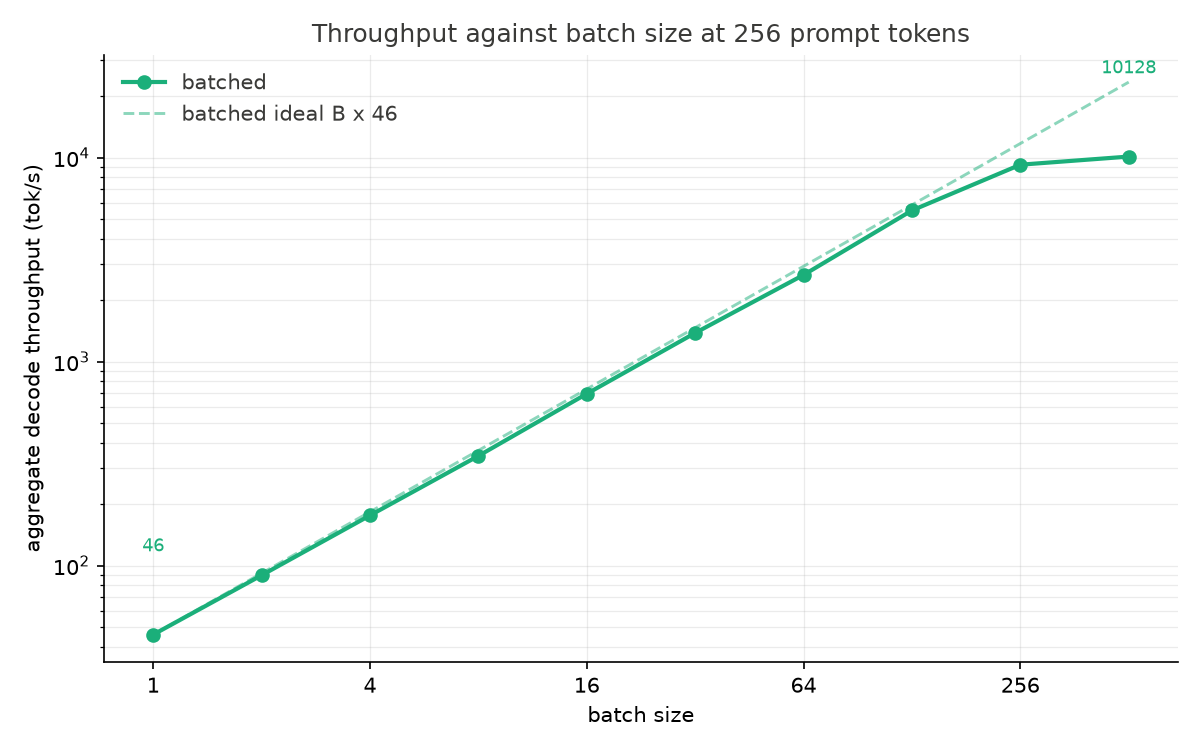
The dashed line is the prediction, B x 45.5. The measured curve follows it
to batch 256 and falls below it after.
Five configurations did not run. At p256 batch 1024, p1024 batch 256 and 512, and p4096 batch 64 and 128, the GPU could not allocate the memory the run needed. The error was caught, the run was skipped, and the failure was recorded. The section on memory below explains all five failures with one formula.
The TTFT column is the cost. At batch 1 it is the same as Part 2's, 25 to 248 ms across those prompt lengths. At the largest batch sizes it is seconds, because every request in the batch waits for one shared prefill over all B prompts. Raising the batch size raises throughput and time to first token together. Parts 1 and 2 had no tradeoff like this. Every change there was simply better. This one is a choice, which is why the headline is reported per prompt length and batch size rather than as one number.
Where scaling stops, and why the prediction missed
The prediction said scaling ends when reading the cache out of GPU memory takes longer than the step's 22 ms, which works out to about 353,000 cached positions in total. Measured, the three short prompt lengths all stop scaling between batch 256 and 512, holding far fewer positions than that:
| prompt | B | cached positions | aggregate decode tok/s | % of B x 45.5 |
|---|---|---|---|---|
| p16 | 512 | 139,264 | 12,287 | 53% |
| p64 | 512 | 163,840 | 11,831 | 51% |
| p256 | 512 | 262,144 | 10,127 | 43% |
| p16 | 1024 | 278,528 | 12,766 | 27% |
| p64 | 1024 | 327,680 | 12,262 | 26% |
Throughput converges. Three different prompt lengths, two different batch sizes, and the aggregate rate lands between 10,100 and 12,800 tokens per second regardless. A limit set by memory traffic cannot produce that convergence, because these configurations move very different amounts of cache per step. A limit set by arithmetic can, because every decoded token costs the same 3.09 GFLOPs of matrix work whatever its context length.
The arithmetic: 12,766 tokens/s times 3.09 GFLOPs per token is 39.4 TFLOPS, against the A10's nominal 125. The memory system, meanwhile, is nowhere near its limit. At p16 and B=1024 a decode step moves the 3.09 GB of weights plus about 4.2 GB of cache in an 80 ms step, roughly 91 GB/s against the 600 GB/s the card can read at, 15% of it.
Decode is now limited by arithmetic, which no engine in this series has been before. Every previous one was waiting on memory or on the CPU.
The 22 ms of CPU cost per step, which bound Parts 1 and 2, no longer binds anything. At batch 256 and p16 a step still takes about 22 ms and produces 256 tokens instead of one.
Memory ran out first at three prompt lengths, and the prediction said it would not
Part 2's prediction ruled that memory capacity would not bind: 19 GiB free holds 711,000 cached positions, and reading traffic was supposed to become the limit at 353,000, so the card should always run out of read speed before it runs out of space. Instead, five configurations failed to allocate memory, and every failure is the same allocation: the largest intermediate tensor of a prefill forward pass, with shape batch by padded length by 8,960, the model's MLP width, in fp16.
That term is B x L x 8,960 x 2 bytes, and it explains all five failures to
the byte. At p1024 and B=256 it is 256 x 1024 x 8,960 x 2 = 4.38 GiB, in one
piece, on top of 8.75 GiB of cache and 2.88 GiB of weights. The other four
land at 4.38 or 8.75 GiB the same way, since batch times padded length is the
only thing that moves. The card has 22.06 GiB.
The prediction's memory model had two terms, weights and cache, both of which persist for a whole run. Prefill activations are transient. They exist for one layer of one forward pass, and they are proportional to batch times padded length, which is exactly the product a batched prefill maximizes. There is a smaller transient of the same kind at every decode step: the logits come out as batch by vocabulary, 151,936 wide, and sampling casts them to fp32, so at B=1024 about 933 MB exists per step that no part of the accounting includes.
The practical consequence is that the configurations approaching the memory traffic limit never reached it. p1024 at B=128 was reading at 289 GB/s and p4096 at B=32 at 302 GB/s, the two highest rates measured anywhere in this series at 48% and 50% of the card's 600 GB/s, both still scaling at 87% and 96% of ideal, and both failed to allocate their next batch size.
Ragged batches: mixed lengths cost more than the padding alone
The uniform numbers above are the engine's best case by construction: every row identical, and every position reserved in the cache holding a real token. One draw of a realistic mix, 8 and 32 requests with prompts drawn across all five lengths and budgets drawn from 64 to 256 tokens, measures the gap.
Both draws happened to include at least one 4096 token prompt, so padding stretches every row to 4096 columns. The control is therefore the uniform p4096 run at the same row count: a batch whose tensor has exactly the same width, but where every position is a real token. The B=32 control is the p4096 row in the results table above, and the B=8 control comes from the same sweep at the smaller batch size.
| B | aggregate decode tok/s | all p4096, same width, no padding | reserved KV slots that are padding | budget reserved but unspent |
|---|---|---|---|---|
| 8 | 124 | 358 | 38.0% | 1.3% |
| 32 | 148 | 1,393 | 48.3% | 1.5% |
The ragged batch reaches roughly a third of its same width control at B=8 and a tenth at B=32.
Two things are being paid for at once, and only one of them is the padding. A padded batch also computes differently: telling the model which positions are padding disables the fused attention path the uniform runs use, so the ragged batch runs a slower kernel over a wider tensor. The 48.3% padding figure says half the reserved cache is dead weight. The throughput gap says the compute cost of carrying that dead weight is larger still. This is why a paged cache layout, which stores only real tokens, is not just a memory optimization.
One reporting rule for these runs. Rows in a batch share one clock, so a per row throughput or latency number is meaningless for a ragged batch. A row with a 64 token budget would carry timing for steps it never ran. Every ragged number above is an aggregate over whole batches.
Open arrivals: the engine serves 0.66 requests per second no matter what is asked of it
Everything above hands the engine its whole workload at time zero, which is the one situation a serving system never sees. The arrival test draws the same ragged mix and delivers it as a Poisson stream at a fixed rate. The engine takes up to 32 of whatever has arrived, runs that batch to completion, and only then looks at the queue again. Waiting is measured from arrival, because measuring from batch start reports a delay no client experiences.
| arrival rate | served | queue p50 | queue p95 | TTFT p95 | achieved rate |
|---|---|---|---|---|---|
| 1/s | 400 | 75.5 s | 165.2 s | 175.8 s | 0.65/s |
| 3/s | 400 | 204.0 s | 420.9 s | 431.1 s | 0.66/s |
| 5/s | 400 | 236.8 s | 481.6 s | 489.9 s | 0.66/s |
| 7/s | 400 | 255.8 s | 475.2 s | 485.7 s | 0.67/s |
The last column is the finding. Serving 400 requests takes about 600 seconds at every arrival rate. The engine serves at the rate its batches complete, whatever the arrival rate is: a full ragged batch of 32 runs about 47 s, and 32 requests per 47 s is 0.68 per second. Every rate tested, including the lowest, exceeds the engine's capacity, so at every rate the queue grows for as long as requests keep arriving. At 1 request per second the median request waits 75 seconds for batches it is not allowed to join, for work that takes 7 seconds once it starts.
The closed tests and this one describe the same engine. 12,766 tokens/s and a median wait of over a minute at one request per second are both true, and the second number is the one a user of the system would meet. This is the number the next engine exists to fix.
Caveats
The ragged and arrival results are one seeded draw each. A draw without a 4096 token prompt would pad less and score better. How much better is a distribution this part did not sample.
Every number here was measured by an engine that stops after each decode step to read the clock and fetch the sampled tokens. A control run with those stops disabled is 2 to 6% faster at every batch size tested. The published numbers are left unadjusted, because the measured configuration is the reproducible one.
Bottleneck, and what follows
The binding constraint is admission. The engine's capacity on the mixed workload is 0.66 requests per second, set by the batch that runs to its slowest member while finished rows ride along, arrivals wait outside, and padding fills half the cache. The card underneath is demonstrably capable of 12,766 tokens/s on the same model.
Continuous batching removes the admission constraint: form the batch every step instead of once, admit arrivals into slots that free up, and evict rows the moment they finish. Paged attention removes the padding: store only real tokens, so a ragged mix stops paying for its widest member.
Prediction
The mixed stream generates 158 tokens per request on average, so 1 request per second needs roughly 158 tokens/s of decode, which this part's engine delivers at batch 4. A continuous engine admitting into a batch of 32 should therefore hold the queue near empty at 1 per second: queue p50 under 1 second at rate 1, against 75.5 s here. Its ceiling on this workload should be near the ragged decode rate at full batch divided by tokens per request, about 148/158 = 0.94 requests per second with this part's padded attention, and meaningfully higher once padding is removed. I expect between 2 and 4 requests per second sustained with per step admission and no padding, and the next writeup will grade this range. Time to first token at low rate should return to prefill plus a short queue, under 2 seconds at p95, against 175.8 s here.
Reproducing this
One invocation per prompt on a Modal A10:
uv run modal run modal_app.py::main --engine batched --prompts p64,p16 \
    --batch-size 1,2,4,8,16,32,64,128,256,512,1024
uv run modal run modal_app.py::main --engine batched --prompts p256 \
    --batch-size 1,2,4,8,16,32,64,128,256,512,1024
uv run modal run modal_app.py::main --engine batched --prompts p1024 \
    --batch-size 1,2,4,8,16,32,64,128,256,512
uv run modal run modal_app.py::main --engine batched --prompts p4096 \
    --batch-size 1,2,4,8,16,32,64,128
uv run modal run modal_app.py::main --engine batched --mixed-seed 0 \
    --batch-size 8,32,128
uv run modal run modal_app.py::main --engine batched --prompts p256 \
    --batch-size 128,256 --pool-gib 2
uv run modal run modal_app.py::arrivals --engine batched \
    --rates 7,5,3,1 --n-requests 400 --max-batch 32
uv run modal run scripts/measure_overhead.py::sync_control \
    --configs "p256:8,p256:256,p16:512,p16:1024"
uv run python scripts/plot_batching.py
Greedy decoding, seed 0, 256 token budget, 2 warmup and 5 recorded runs per
configuration. Raw rows are in the repo under results/batched/, one row per
sequence, batches recoverable through the batch id column, with arrival
records and the sync control's output beside them. Token parity against the
cached engine was checked at batch 1, batch 4 uniform, and on a ragged batch
before any benchmark ran.