Continuous batching
infer/engines/continuousContents
Part 3's engine formed a batch once and ran it until its slowest member finished, and under a stream of arriving requests it served 0.66 requests per second at every arrival rate tested, with the median request waiting 75.5 seconds. This part re-forms the batch every step. At 1 request per second the median request now waits 0.02 seconds, down from 75.5, and its 95th percentile time to first token is 0.34 seconds, down from 175.8. The engine sustains about 1.25 requests per second before the queue starts growing, 1.9x the static engine's capacity.
Part 3 ended with three predictions for this engine: the median queue wait at 1 request per second would fall below 1 second, time to first token at that rate would fall below 2 seconds at the 95th percentile, and the engine would sustain between 2 and 4 requests per second. The first two held, at 0.02 and 0.34 seconds. The third missed: measured capacity is 1.25 requests per second. A later section locates the missing capacity. Removing finished requests from the batch bought less than the prediction assumed. The rest of the predicted capacity needs a different cache, because when one 4096 token prompt is anywhere in the batch, every request's attention is computed as if its own context were that long.
What changed
The static engine decided a batch's membership once. This engine decides it every step. One step is: admit waiting requests into free slots, run one decode pass over every active request, evict the ones that finished. A request that arrives mid stream waits only for the current step and a free slot, not for a whole batch to drain, and a request that finishes leaves its slot immediately instead of riding along as dead weight.
The cache makes that possible. The engine allocates one buffer per layer with 32 slots, each wide enough for the longest prompt plus the 256 token budget. A request occupies one slot for its lifetime, its tokens stored from column 0 with its own length counter. When a request finishes, the last active row is moved into the freed slot, so the live rows always sit in a contiguous block at the front of the buffer and the decode pass runs on a view of that block with nothing copied per step.
Admission is the new cost. A newly admitted request needs its prompt processed, and that prefill runs inside the same step the running requests are waiting on. The gap between two of an incumbent's tokens therefore stretches when someone joins, and a later section measures by how much.
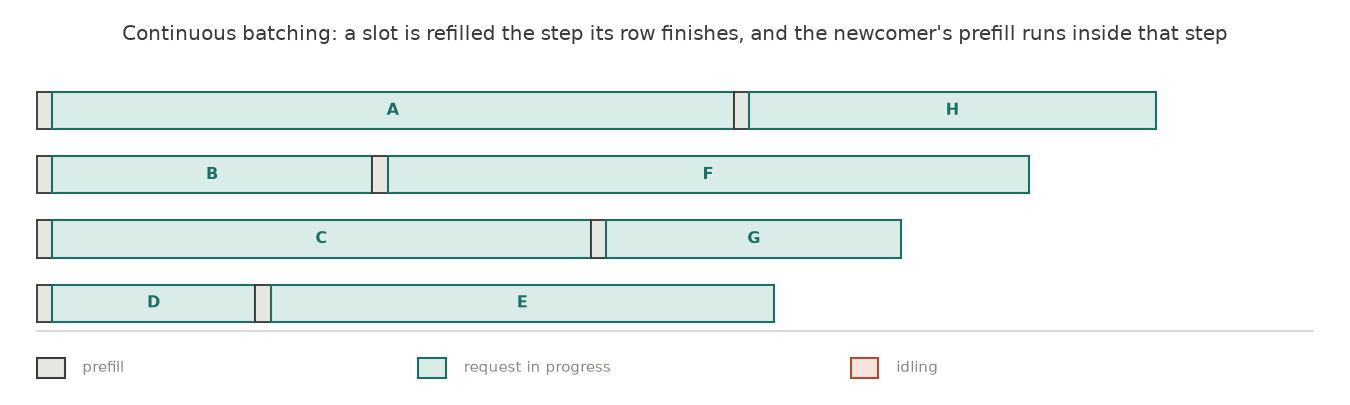
The same eight requests through the same four slots, at the same scale and over the same range as the figure in Part 3. Nothing is red, because a slot is refilled the step its row finishes, and each newcomer's prefill is the grey block immediately before its first token.
Because rows join at different times with different lengths, every decode step tells the model which cache columns belong to which row through a mask, the same arrangement Part 3's mixed batches used. There is no unmasked fast path here at all.
Everything else is held where the earlier parts fixed it: Qwen2.5-1.5B in fp16, one Modal A10, the same five exact prompts, greedy decoding from seed 0, a 256 token budget unless a draw assigns a smaller one, 2 warmup and 5 recorded runs for closed configurations. Before any benchmark ran, this engine's output was checked token for token against Part 2's engine on a single request, a uniform batch, a mixed batch, and a queue of 8 requests forced through 4 slots. All match exactly.
What I expected
Part 3 recorded this prediction:
The mixed stream generates 158 tokens per request on average, so 1 request per second needs roughly 158 tokens/s of decode, which this part's engine delivers at batch 4. A continuous engine admitting into a batch of 32 should therefore hold the queue near empty at 1 per second: queue p50 under 1 second at rate 1, against 75.5 s here. Its ceiling on this workload should be near the ragged decode rate at full batch divided by tokens per request, about 148/158 = 0.94 requests per second with this part's padded attention, and meaningfully higher once padding is removed. I expect between 2 and 4 requests per second sustained with per step admission and no padding, and the next writeup will grade this range. Time to first token at low rate should return to prefill plus a short queue, under 2 seconds at p95, against 175.8 s here.
Queue p50 at rate 1: measured 0.02 s against the predicted bound of 1 s. TTFT p95 at rate 1: measured 0.34 s against the predicted bound of 2 s. Both hold with a wide margin, and for the reason the prediction gave: 1 request per second needs about 158 tokens per second of decode, and the engine produces that with a batch of 4 slots while 28 sit free.
Sustained capacity: measured 1.25 requests per second against the predicted 2 to 4. The floor arithmetic in the same paragraph, 0.94 from the measured mixed rate at full batch, was beaten. The 2 to 4 range was conditioned on "no padding", and that condition describes an engine this part did not build. Eviction removes finished rows. It does not shrink the span of cache columns the remaining rows are masked across, and that span is where the capacity went.
Results
Six arrival rates, 400 requests each, 32 slots. Rates 1, 3, 5 and 7 replay the exact seeded traces Part 3 ran, so the static column is the same requests arriving at the same moments. Waiting is measured from arrival.
| rate | queue p50 | queue p95 | TTFT p95 | achieved rate | static achieved | static queue p50 |
|---|---|---|---|---|---|---|
| 1/s | 0.02 s | 0.06 s | 0.34 s | 0.94/s | 0.65/s | 75.5 s |
| 2/s | 37.2 s | 87.0 s | 87.2 s | 1.26/s | not run | not run |
| 3/s | 73.4 s | 157.2 s | 157.4 s | 1.24/s | 0.66/s | 204.0 s |
| 4/s | 89.3 s | 188.0 s | 188.2 s | 1.24/s | not run | not run |
| 5/s | 103.1 s | 218.3 s | 218.5 s | 1.19/s | 0.66/s | 236.8 s |
| 7/s | 126.6 s | 254.7 s | 255.1 s | 1.14/s | 0.67/s | 255.8 s |
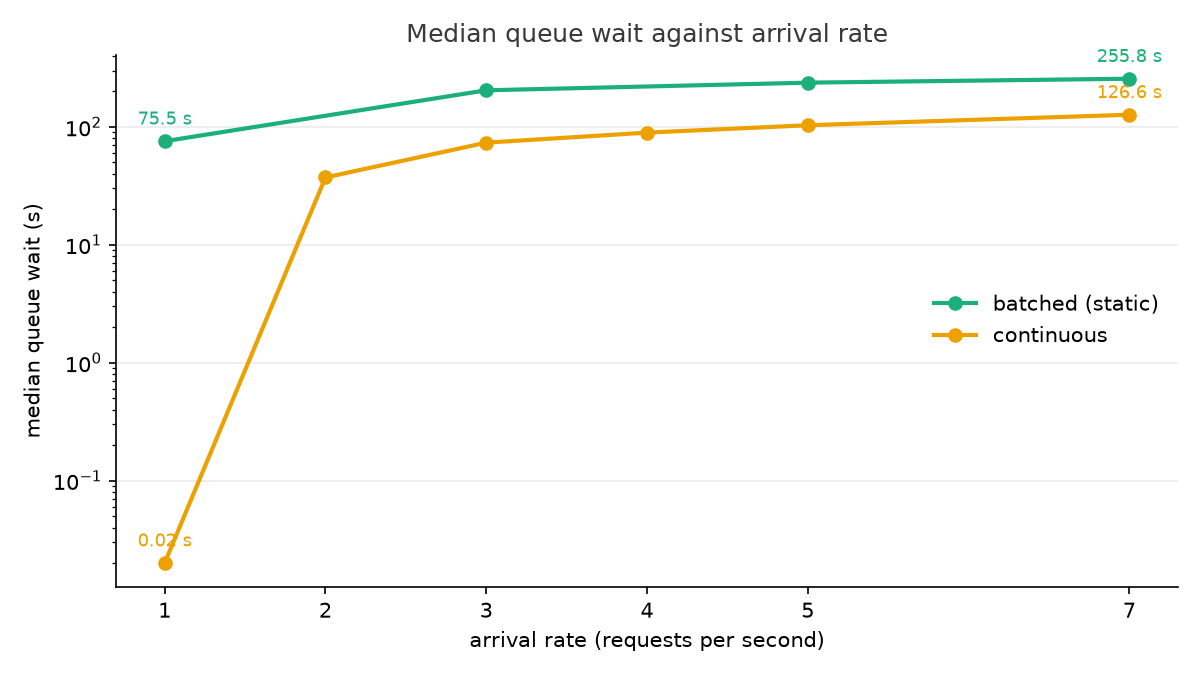
At rate 1 the achieved rate equals the arrival rate and the queue is empty: the engine is keeping up, and 0.94 rather than 1.00 only because the span includes the tail of the last requests finishing. At rate 2 and above the achieved rate pins at 1.14 to 1.26 whatever is asked, which is what a capacity of about 1.25 requests per second looks like from the outside. The static engine pinned at 0.66 on the same traces.
The step from rate 1 to rate 2 is the one to read. Below capacity the median queue wait is 0.02 s. One request per second above it, the median is 37.2 s, a factor of 1,860 for a 2x change in arrival rate. Past capacity the wait is set by how long the queue has been growing rather than by how long the work takes.
Where the missing capacity went
At saturation the engine produces 195 to 198 tokens per second of output. The predicted 2 to 4 requests per second would have needed 300 to 600, at the 158 tokens per request the draw generates. Two costs, both measured in this part's runs, account for the gap.
Width. The closed controls ran the same seeded 32 request mixed draw Part 3 ran. This engine finishes it in 34.3 s against the static engine's 46.9, 27% faster, entirely from evicting finished rows. But 34.3 s for 5,440 tokens is still only 158 tokens per second, against 1,264 for a uniform batch of 32 at 256 prompt tokens. The draw contains 4096 token prompts, the mask spans every column up to the widest row, and attention is computed across that span for all 32 rows. Eviction cannot fix this. The cache stores each row's real tokens only, but the computation is still shaped by the widest member.
Prefill share. At 1.25 admissions per second, with the draw's mean prompt of about 1,100 tokens, the engine runs roughly 1,375 prompt tokens of prefill per second. Measured inside the disturbance run below, a 4096 token prefill in a running batch costs about 0.69 s, which is 5,900 prompt tokens per second, so prefill occupies roughly a quarter of wall time at saturation. That fraction is structural: it scales with the arrival rate, and it is paid out of the same seconds decode needs.
What admission costs the rows already running
One closed run measures the disturbance directly: 64 mixed requests forced through 8 slots, with per token timing kept for every request. A slot frees, a newcomer's prefill runs inside the step, and every running row's next token waits for it.
The baseline gap between an incumbent's tokens is 46.2 ms. The run contains 12 distinct steps where the gap spiked past three times that, and the spike sizes group by what was admitted.
| what was admitted | gap in that step |
|---|---|
| nothing, baseline | 46.2 ms |
| a 1024 token prompt | about 300 ms |
| a 4096 token prompt | 685 to 692 ms |
| the worst step in the run | 973 ms |
A running request's inter token latency is 46 ms until a 4096 token prompt joins its batch, and 690 ms, 15x, in the step that admits one.
This is the tradeoff this part bought. Part 3 traded throughput against time to first token, and raising the batch size moved both. Here the newcomer's wait is traded against the incumbents' latency: the same prefill that gives an arriving request its 0.34 s TTFT is the spike inside someone else's stream. Nothing in this engine bounds that spike. The standard fix is to split a long prefill into fixed size chunks so decode steps run between them, and this part did not build it.
Caveats
The mixed draws and arrival traces are one seeded sample each, shared with Part 3 by construction. A draw without a 4096 token prompt would show less width cost and smaller admission spikes. How much less is a distribution neither part sampled.
The capacity decomposition attributes the gap to width and prefill share by arithmetic from measured quantities, not by profiling the steps directly. A per step trace separating mask width cost from batch size cost would pin it, and belongs to the part that changes the cache layout, since that is the change the answer would steer.
Bottleneck, and what follows
The binding constraint is the shape of attention over the cache: one wide row makes every row's step wide, and prefill for admissions competes for the same seconds. The card is still nowhere near its limits at saturation, 198 tokens per second against the 1,264 a uniform batch of the same size produces.
A paged cache stores each row's tokens in fixed size blocks and lets attention read each row at its own true length, so the batch stops paying for its widest member. That is the next engine.
Prediction
Uniform batches of 32 decode at 1,264 to 1,400 tokens per second at every
prompt length from 256 to 4096, so attention over true lengths at batch 32
should put the mixed draw's decode near that band rather than at 158.
Discounting prefill share, which at rate r costs about r x 1,100 / 5,900
of wall time, capacity solves to roughly 3 requests per second: 158r tokens
of decode at 1,300 tokens per second plus the prefill fraction reaches 1 at
about r = 3.3. I expect the paged engine to sustain between 2.5 and 3.5
requests per second on this workload, to hold queue p50 under 1 second at
rate 2, and the next writeup will grade both. The admission spike from a
4096 token prefill should not shrink, since paging changes where tokens
live, not how a prompt is processed.
Reproducing this
uv run modal run modal_app.py::main --engine continuous --prompts p256 \
    --batch-size 8,32
uv run modal run modal_app.py::main --engine continuous --mixed-seed 0 \
    --batch-size 8,32
uv run modal run modal_app.py::main --engine continuous --mixed-seed 0 \
    --batch-size 64 --max-batch 8
uv run modal run modal_app.py::arrivals --engine continuous \
    --rates 7,5,4 --n-requests 400 --max-batch 32
uv run modal run modal_app.py::arrivals --engine continuous \
    --rates 3,2,1 --n-requests 400 --max-batch 32
uv run python scripts/plot_batching.py
Greedy decoding, seed 0, 2 warmup and 5 recorded runs per closed
configuration. Raw rows are in the repo under results/continuous/, one row
per request with its own timing, plus the arrival records beside them.
The disturbance numbers come from the per token times recorded for the 64
request configuration. Token parity against the cached engine was checked
at batch 1, uniform batch 4, a mixed batch, and 8 requests queued through 4
slots before any benchmark ran.