Chunked prefill
infer/engines/chunkedContents
Part 5's engine admitted new requests by padding every prompt in the group to the longest one and running the padded batch as one prefill, and every request already running stalled until that prefill finished. This part streams prompts into the cache in fixed 512 token pieces instead, with decode steps interleaved between the pieces, so nothing ever waits on a whole prompt. The engine serves 3.98 requests per second when seven arrive per second, against 2.90 for the paged engine, whose served rate falls once arrivals outrun it. The longest pause an already running request takes while others are admitted drops from 2874 ms to 78 ms, and a batch of 32 mixed length requests handed over at once finishes in 10.8 s against Part 5's 18.0 s.
What changed
The one thing this part changes is how prompts enter the KV cache. Since Part 5 that cache is a pool of fixed size blocks, each block holding 64 tokens of one request's keys and values, and this part keeps that layout. The paged engine admitted a group of requests by padding every prompt to the group's widest, running one dense prefill over the padded batch through a throwaway cache, and copying the result into the pool. Admission therefore stalled every running request for the full prefill, and the padding did work that was thrown away.
This engine prefills in chunks instead. Each scheduling step packs at most 512 prompt positions, taken first come first served across whatever requests are mid prefill, into a single forward whose query dimension is the packed sequence. There is no padding because nothing is ever widened, and there is no copy because each position's K and V land directly in the request's pool blocks during the forward. A prompt longer than the budget takes several steps, and decode steps for the running requests interleave between its chunks, so no admission can stall anyone for longer than about one chunk of work. A request's first token is sampled at its final prompt position, in whichever step its last chunk runs.
Decode is untouched from Part 5: one query row per running request, each row reading only its own blocks. Each step therefore runs up to two forwards, a packed prefill forward when chunks are scheduled and a per row decode forward when anything is decoding. The attention kernel forces that separation. It tiles the query dimension in blocks of 32, so decode tokens packed into the prefill's query sequence land in one tile whose block list is the union of every request's blocks, and the kernel walks that union serially. On identical cache state one attention call over 32 decode tokens costs 0.347 ms as separate rows and 1.749 ms packed, 5.04x, and the model makes that call once per layer, so packing would add about 39 ms to every decode step.
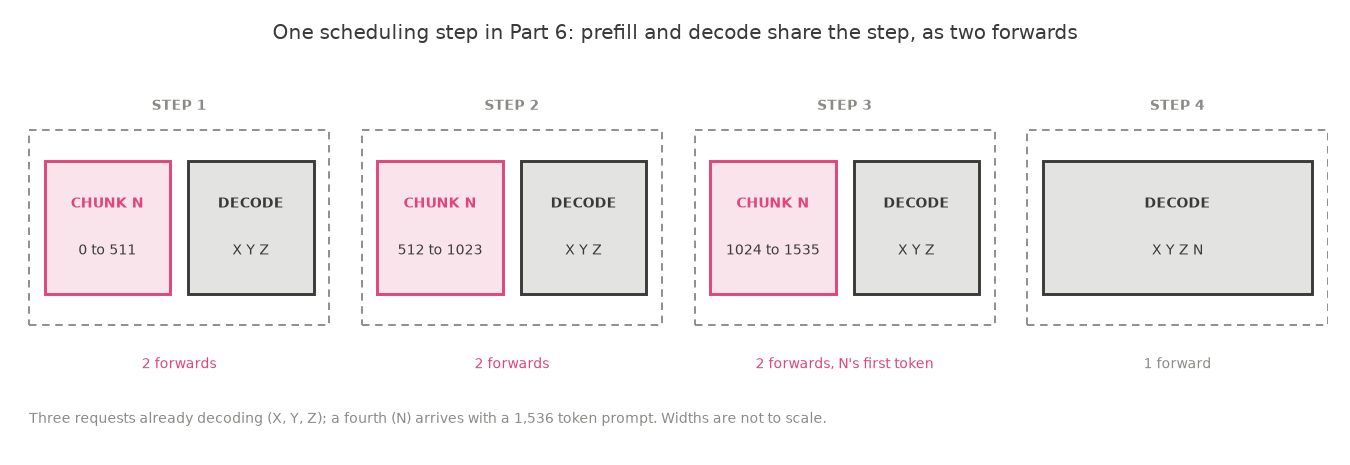
Everything else carries over from Part 5 unchanged: the block pool with reserve on admit, strict first come first served admission with head of line blocking, eviction at the end of the step, and iteration level scheduling.
Setup: Qwen2.5 1.5B in fp16 on a Modal A10, greedy decoding, seed 0. Closed runs hand the engine its whole batch at time zero and time the batch to completion, 5 recorded runs after 2 discarded warmup runs. Open runs deliver requests one at a time while the engine works, replaying 400 Poisson arrivals per rate from a fixed seed, with prompts drawn from a mix of 16, 64, 256, 1024, and 4096 token lengths and generation budgets from 64 to 256 tokens. The attention kernels are compiled at engine construction, which runs real forwards through every shape the engine can reach, so no measured step includes a compile. The engine's outputs are token exact against the cached, continuous, and paged engines on every workload checked before any benchmark ran, with two exceptions, each a single position where the top two logits differ by at most one fp16 step.
What I expected
Part 5 recorded this prediction:
I expect the chunked engine to sustain between 3.5 and 4.5 requests per second, to keep queue p50 under 1 second at rate 3, and to cap the admission spike near the cost of one chunk, about 90 ms for a 512 token chunk at the measured 5,900 prompt tokens per second, against 280 to 982 ms here.
All three held. Sustained service is 3.98 to 4.08 requests per second at rates 5 through 7, against the predicted 3.5 to 4.5. Queue p50 at rate 3 is 0.02 s, against the predicted bound of 1 s. The worst inter token gap under continuous admission is 77.5 ms, against the predicted 90 ms.
The same prediction also said the closed mixed run should drop from 18.0 s to about 12 s. It dropped further, to 10.8 s. And it said the closed uniform controls should get slightly worse, because chunking adds steps. They got better instead, 8.08 s against 8.44 s at 32 rows, and the reason is a cost the prediction forgot the old admission was paying, graded in its own section below.
Results
Closed runs, median of 5, total wall time for the whole batch:
| workload | paged (Part 5) | chunked | change |
|---|---|---|---|
| mixed batch 8 | 10.05 s | 8.52 s | 1.18x |
| mixed batch 32 | 18.02 s | 10.78 s | 1.67x |
| uniform p256 batch 8 | 7.75 s | 7.53 s | 1.03x |
| uniform p256 batch 32 | 8.44 s | 8.08 s | 1.04x |
The five mixed 32 runs span 10.61 to 11.00 s, a spread of 3.7%.
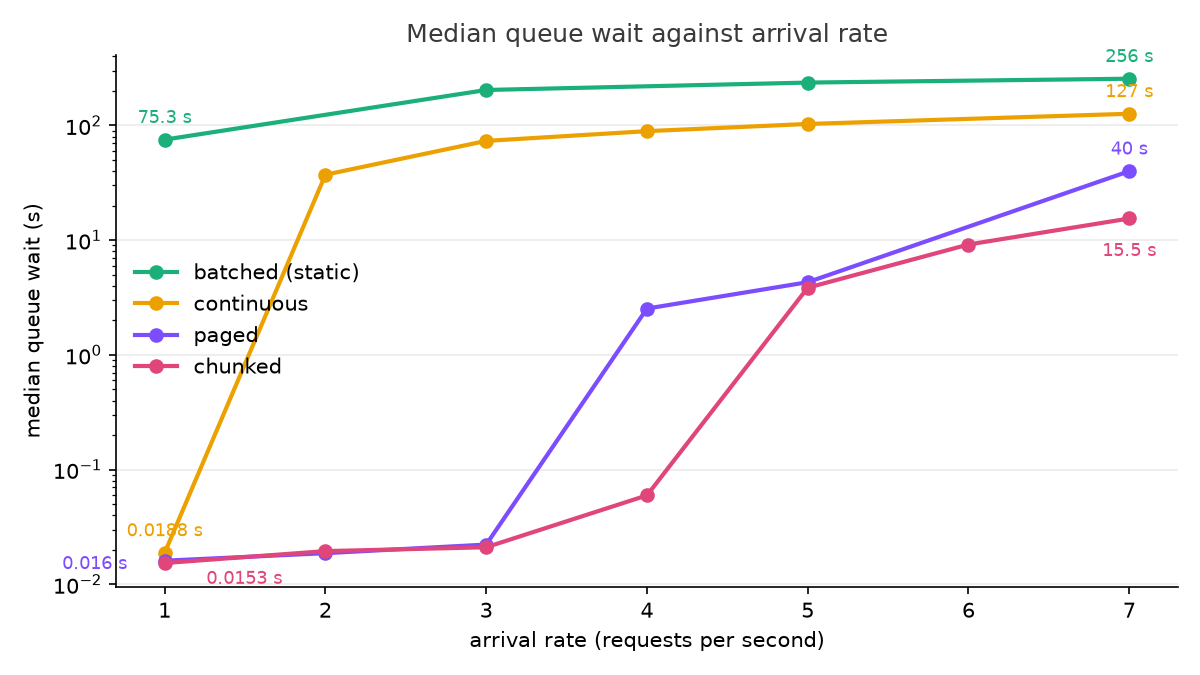
Open arrivals, 400 requests per rate, served rate and median queue wait:
| rate | paged served | chunked served | paged queue p50 | chunked queue p50 |
|---|---|---|---|---|
| 1 | 0.94/s | 0.94/s | 0.02 s | 0.02 s |
| 2 | 1.85/s | 1.85/s | 0.02 s | 0.02 s |
| 3 | 2.72/s | 2.72/s | 0.02 s | 0.02 s |
| 4 | 3.45/s | 3.55/s | 2.53 s | 0.06 s |
| 5 | 3.90/s | 3.98/s | 4.30 s | 3.89 s |
| 6 | not run | 4.08/s | 9.21 s | |
| 7 | 2.90/s | 3.98/s | 40.0 s | 15.47 s |
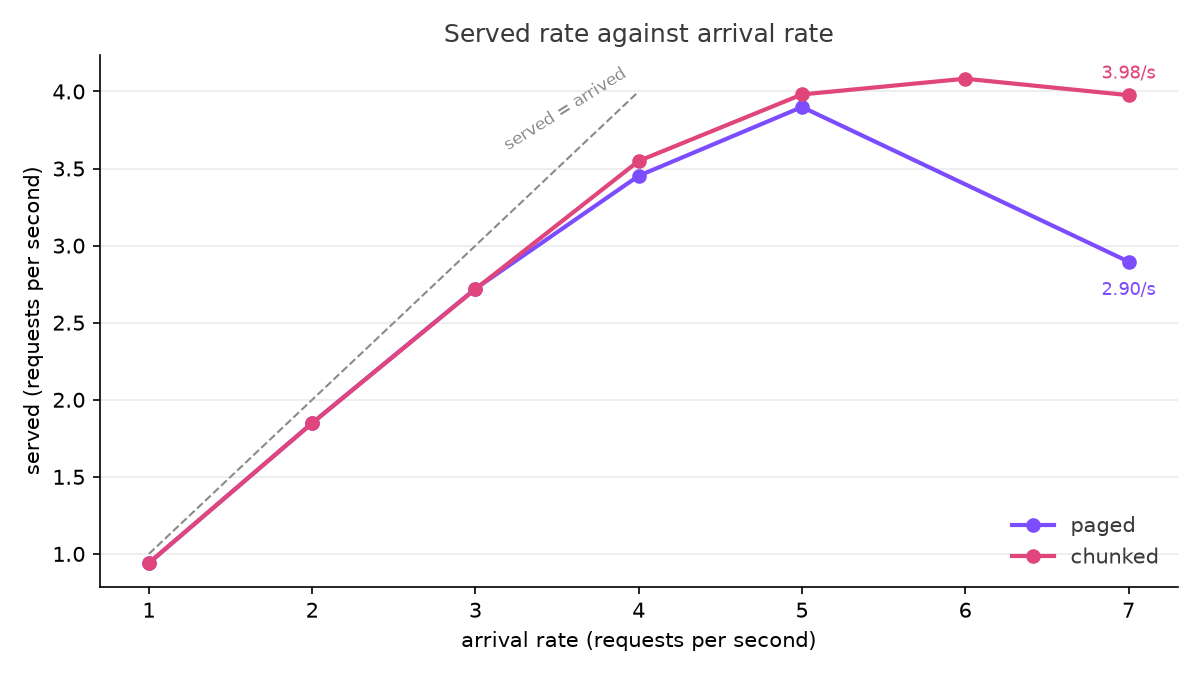
The paged engine's served rate fell 26% from its peak as the arrival rate climbed past capacity, because deeper queues made wider padded admission groups. The chunked engine has no padding to widen, and it holds within 2% of its 4.08 peak through rate 7. Holding the peak is not keeping up. At any rate above the 4.08 capacity the queue grows for as long as arrivals continue, and the engine has no way to refuse work, so the flat served rate means it degrades by queueing rather than by shrinking.
The disturbance control measures what admission costs the requests already running: 64 mixed requests queued through 32 rows, so admission happens continuously while incumbents decode. Part 5 published this control at 8 rows and it is run at 32 here, with the paged engine rerun at 32 rows alongside, so the numbers below are not the 29.8 ms and 982 ms that part reported. A wider batch gives an admission group more incumbents to stall and more rows to pad against, which is why the worst paged gap is three times larger here. Consecutive token gaps for the incumbents:
| incumbent token gap | paged | chunked |
|---|---|---|
| median gap | 29.6 ms | 31.1 ms |
| worst gap | 2874 ms | 77.5 ms |
| gaps over 150 ms | 355 of 48,320 | 0 of 48,320 |
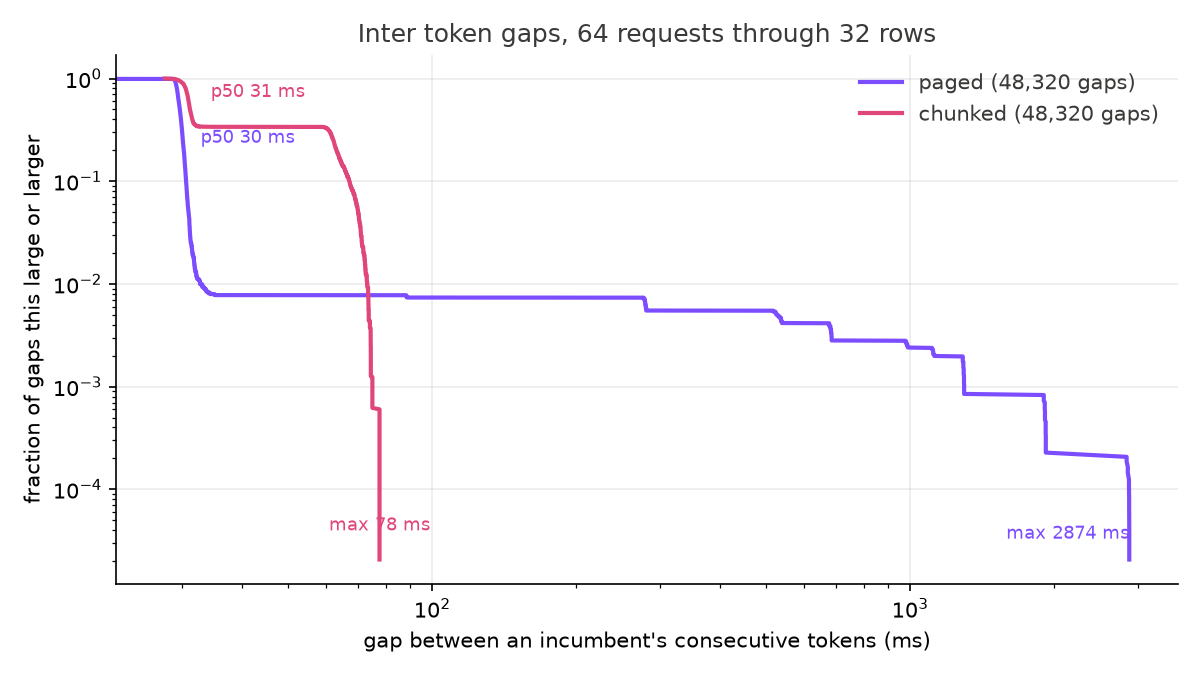
The median is 5% above paged's, the price of sharing each step with up to 512 prompt positions. Every admission stall the paged engine took, up to 2874 ms when a 4096 token prompt arrived, is capped at 78 ms, less than the cost of three decode steps.
The small pool control also reruns unchanged: the pool capped at 0.5 GiB, which covers about 34% of the mixed draw's worst case reservations, at rates 2 and 3. At rate 2 both engines serve 1.85 per second. At rate 3 the paged engine served 1.88 per second and the chunked engine serves 2.43, 29% more from the same memory, because a blocked admission now blocks at most one chunk of scheduled work rather than a whole padded group.
Why the uniform controls got faster instead of slightly worse
Part 5's prediction expected the uniform controls to get slightly worse, because chunking replaces one admission forward with several and equal length prompts have no padding to save. The controls got 3 to 4% faster instead, because the old admission was paying a cost the prediction left out. The paged engine prefilled through a throwaway dense cache and then copied every K and V vector into the pool, an extra write and read of the whole prefill's KV. The chunked engine writes each vector into its pool block during the forward and never touches it again. At 32 rows of 256 token prompts that copy was about 4% of the run, and deleting it slightly outweighs the cost of the added steps.
What the chunk budget is worth
The chunk budget trades throughput against admission latency. Closed mixed 32, median of 5 runs, with time to first token for the batch:
| chunk budget | total | first token |
|---|---|---|
| 128 | 15.31 s | 0.24 s |
| 256 | 12.94 s | 0.12 s |
| 512 | 10.78 s | 0.06 s |
| 1024 | 10.55 s | 0.06 s |
Small budgets pay per step overhead once per 128 positions instead of once per 512, and the run is 42% longer at 128 than at 512. Above 512 the return flattens: 1024 saves another 2% on this workload. I kept 512 as the default because the disturbance guarantee is one chunk of stall, 78 ms measured at 512, and a 1024 budget would roughly double that bound for a 2% throughput return.
Caveats
The mixed draws and the arrival traces are one seeded sample each, shared with Parts 3 through 5 by construction. A draw with more or fewer 4096 token prompts would move both engines' stalls and served rates, and by how much is a distribution this series has not sampled.
The copy accounting in the uniform section is arithmetic from the KV sizes, not a profiled attribution. A per step trace splitting each run into prefill time, decode time, and copy time would pin it. The gap it explains is 3 to 4%, so the arithmetic is the only evidence offered for a small number.
Output is checked to be identical at chunk budgets of 3 and 4096 on a six request workload, so correctness across budgets is tested well outside the 128 to 1024 range measured here.
Bottleneck, and what follows
Prefill stopped being the problem. Admission no longer pads, no longer copies, and no longer stalls anyone for more than a chunk. What remains is decode throughput: 32 rows at a 31 ms median step is roughly 1,030 decode tokens per second, and the served rate curve flattens at 4.08 requests per second exactly where the queue starts growing faster than those rows can drain it.
Reading the model's 3.09 GB of weights at the A10's 600 GB/s takes 5.15 ms, and that read is the only part of the step the hardware requires. The measured step is 31 ms, so about 26 ms is work the engine adds on top: what the host does to launch each of the 28 layers, the step's bookkeeping tensors rebuilt every iteration, and the stop at the end where the host reads the sampled tokens back. Production engines remove most of this by recording the decode step's GPU work once and replaying it every step.
Prediction
Whatever mechanism the next part uses, its measure is the median decode step, 31 ms here. If the next engine lands the step at 15 ms on this workload, sustained service lands between 6.5 and 8.5 requests per second, and if the step does not move, neither does the served rate. The next writeup will grade this against the step time it actually achieves.
Reproducing this
uv run python scripts/gate_chunked.py
uv run modal run modal_app.py::kernel_gate
uv run modal run modal_app.py::decode_layout_bench
uv run modal run modal_app.py::step_trace

uv run modal run modal_app.py::main --engine chunked --mixed-seed 0 --batch-size 8,32 --max-batch 32 --chunk-tokens 512
uv run modal run modal_app.py::main --engine chunked --prompts p256 --batch-size 8,32 --max-batch 32 --chunk-tokens 512
uv run modal run modal_app.py::main --engine chunked --mixed-seed 0 --batch-size 64 --max-batch 32 --chunk-tokens 512
uv run modal run modal_app.py::main --engine paged --mixed-seed 0 --batch-size 64 --max-batch 32
uv run modal run modal_app.py::main --engine chunked --mixed-seed 0 --batch-size 32 --max-batch 32 --chunk-tokens 128
uv run modal run modal_app.py::main --engine chunked --mixed-seed 0 --batch-size 32 --max-batch 32 --chunk-tokens 256
uv run modal run modal_app.py::main --engine chunked --mixed-seed 0 --batch-size 32 --max-batch 32 --chunk-tokens 1024

uv run modal run modal_app.py::arrivals --engine chunked --rates 7 --n-requests 400 --max-batch 32 --chunk-tokens 512
   (repeat for rates 6, 5, 4, 3, 2, 1, one invocation per rate)
uv run modal run modal_app.py::arrivals --engine chunked --rates 3 --n-requests 400 --max-batch 32 --chunk-tokens 512 --pool-gib 0.5
uv run modal run modal_app.py::arrivals --engine chunked --rates 2 --n-requests 400 --max-batch 32 --chunk-tokens 512 --pool-gib 0.5

uv run python scripts/plot_arrivals.py
uv run python scripts/plot_chunked.py
uv run python scripts/plot_steps.py
Greedy decoding, seed 0, Qwen2.5 1.5B fp16, Modal A10. Raw rows land in
results/chunked/runs.csv, results/chunked/runs.jsonl, and
results/chunked/arrivals.csv. The kernel geometry measurement behind
the two forward design is decode_layout_bench, and step_trace prints
per step timing on the disturbance workload, both self contained. Local
gates run on MPS in about 15 minutes and compare the
engine token for token against the cached, continuous, and paged engines,
including a chunk budget invariance gate at budgets 3 and 4096, a tiny
pool admission gate, and freed block poisoning under both attention
backends.