One forward per step
infer/engines/fusedContents
Part 6's engine ran up to two full model forwards per scheduling step, one for prompt prefill and one for decode, about 63 ms for a step that carried both, with the model's fixed costs paid twice. This part runs one forward per step and splits the sequence by kind only inside attention. The engine sustains 4.53 requests per second where Part 6's engine peaked at 4.08, an 11% gain, and holds that rate flat as arrivals climb to 9 per second, where Part 6's served rate falls. The worst inter token stall under continuous admission drops from 78 ms to 69 ms, and the closed mixed batch of 32 improves 7%. The uniform controls get 3 to 5% slower, a real cost this part measures rather than hides.
What changed
The one thing this part changes is how many times the model runs per scheduling step. A step is one turn of the engine's serving loop: it picks the work that runs now, runs the model on it, and retires whatever finished. A forward is one complete pass through the model's 28 layers, and it has a fixed cost that does not depend much on how many tokens ride along. Part 6's engine schedules two kinds of work each step: prompt chunks, at most 512 prompt positions taken first come first served across requests still prefilling, and decode tokens, one per request that has finished prefilling. It ran them as two separate forwards, about 33 ms for a full chunk and about 30 ms for the decode batch, one after the other, roughly 63 ms for a loaded step, meaning a step that carries both kinds of work at once. The 28 layers of norms, projections, rotary embeddings, and MLPs executed twice, and the fixed cost of launching each layer's many small kernels was paid twice.
This engine packs both kinds into ONE unpadded sequence, prompt chunks first and decode tokens last, and runs the model once. The linears, norms, and MLPs process all of it in a single pass. Attention is the one place the two kinds must part ways, and they part inside the attention call: chunk positions run the packed prefill kernel exactly as Part 6 ran it, decode positions are reshaped to one query row per request and run the per row kernel exactly as Part 6 ran it, and the two outputs are concatenated back into packed order.
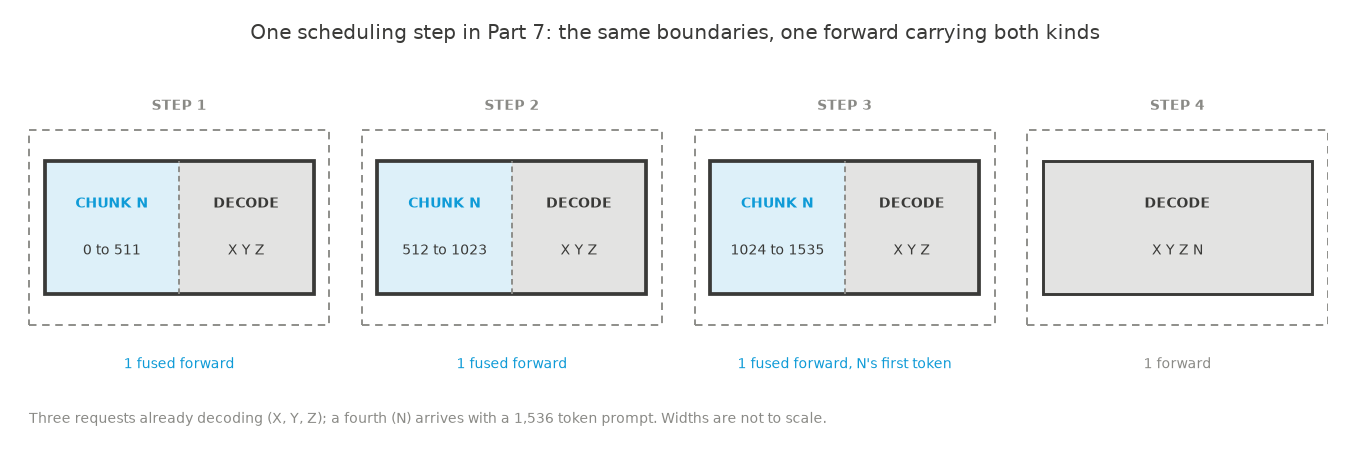
Attention splits because of a measured property of the kernel. The kernel processes query tokens in groups of 32. Left in the packed sequence, the step's 32 decode tokens form one group, and that one group has to read all 32 requests' histories one after another. Given one row each, they form 32 groups that run in parallel, each reading one history. The work is identical and the cost is not: on the same cache state, one attention call over 32 decode tokens takes 0.347 ms as rows and 1.749 ms packed, 5.04x. So chunk positions stay packed, decode positions get rows, and everything outside attention fuses.
Everything else carries over from Part 6 unchanged: the KV pool of fixed size blocks, reserve on admit, strict first come first served admission, the 512 token chunk budget, eviction at the end of the step, and both attention kernels with their masks. One forward also means one sampling call and one host readback per step instead of two.
Setup: Qwen2.5 1.5B in fp16 on a Modal A10, greedy decoding, seed 0. Closed runs hand the engine its whole batch at time zero and time the batch to completion, 5 recorded runs after 2 discarded warmup runs. Open runs deliver requests one at a time while the engine works, replaying 400 Poisson arrivals per rate from a fixed seed, with prompts drawn from a mix of 16, 64, 256, 1024, and 4096 token lengths and generation budgets from 64 to 256 tokens. The attention kernels are compiled at engine construction, which runs real forwards through every shape the engine can reach, so no measured step includes a compile.
What I expected
Part 6 recorded this prediction:
Whatever mechanism the next part uses, its measure is the median decode step. If it lands the step at 15 ms on this workload, sustained service lands between 6.5 and 8.5 requests per second, and if the step does not move, neither does the served rate.
The prediction's premise never happened and its fallback clause is WRONG, which is the most useful outcome a prediction can have. The pure decode step did not move: 31.3 ms against Part 6's 30.4. The served rate moved anyway, 4.08 to 4.53. The prediction modeled capacity as a function of the decode step alone and missed that a loaded step ran two forwards, so there was a third lever: making the prefill work stop being additive. That lever is worth 11%, measured, and the decode step lever remains unpulled.
I also recorded a second prediction before building this engine: loaded steps carrying both kinds of work would fall from 63.9 ms to between 38 and 45 ms, service at 6 arrivals per second would reach 5.5 to 6.5 requests per second, and the pure decode step would stay within noise. The step prediction MISSED low: mixed steps landed at 51.5 ms, not 38 to 45, because the two attention kernels still run one after the other inside the fused call and their combined ~18 ms does not fuse away. The service prediction MISSED by more, 4.39 at rate 6 against the predicted 5.5 to 6.5, for the same reason scaled up. The decode step prediction HELD, 31.3 against 30.4 ms, within 3%.
Results
Closed runs, median of 5, total wall time for the whole batch:
| workload | chunked (Part 6) | fused | change |
|---|---|---|---|
| mixed batch 8 | 8.52 s | 8.55 s | 1.00x |
| mixed batch 32 | 10.78 s | 10.06 s | 1.07x |
| uniform p256 batch 8 | 7.53 s | 7.76 s | 0.97x, 3% slower |
| uniform p256 batch 32 | 8.08 s | 8.51 s | 0.95x, 5% slower |
Open arrivals, 400 requests per rate, served rate and median queue wait:
| rate | chunked served | fused served | chunked queue p50 | fused queue p50 |
|---|---|---|---|---|
| 1 | 0.94/s | 0.94/s | 0.02 s | 0.02 s |
| 2 | 1.85/s | 1.85/s | 0.02 s | 0.02 s |
| 3 | 2.72/s | 2.72/s | 0.02 s | 0.02 s |
| 4 | 3.55/s | 3.57/s | 0.06 s | 0.02 s |
| 5 | 3.98/s | 4.28/s | 3.89 s | 1.38 s |
| 6 | 4.08/s | 4.39/s | 9.21 s | 5.32 s |
| 7 | 3.98/s | 4.53/s | 15.47 s | 8.77 s |
| 8 | not run | 4.50/s | 12.56 s | |
| 9 | not run | 4.53/s | 15.19 s |
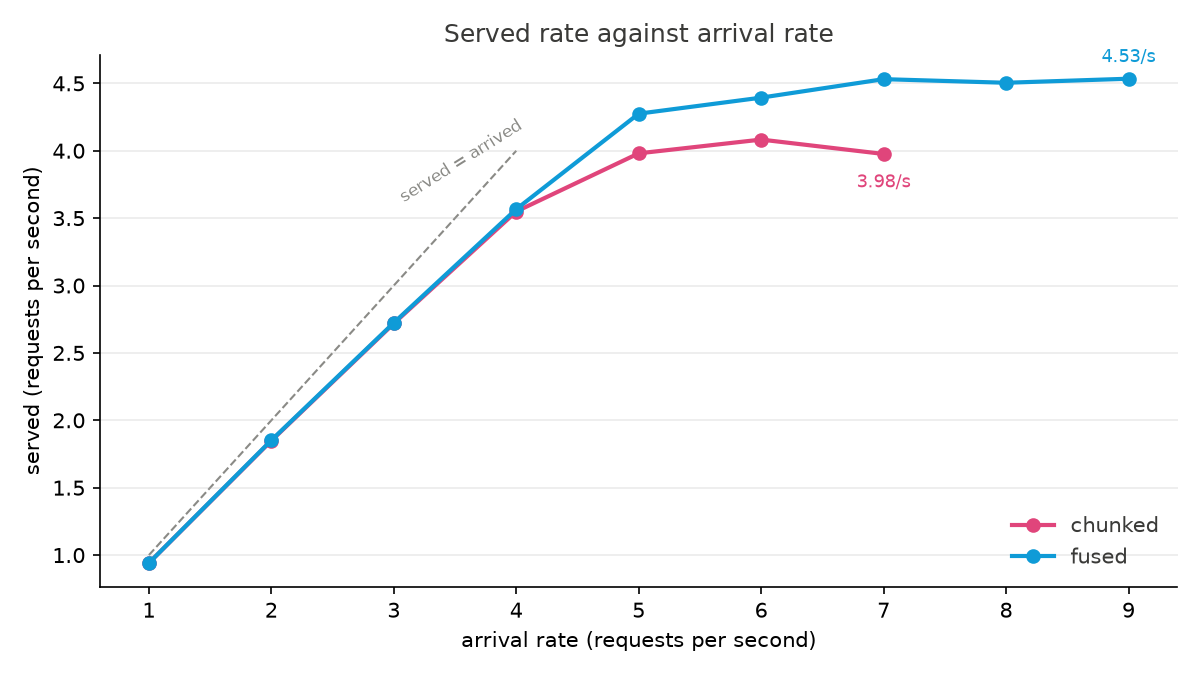
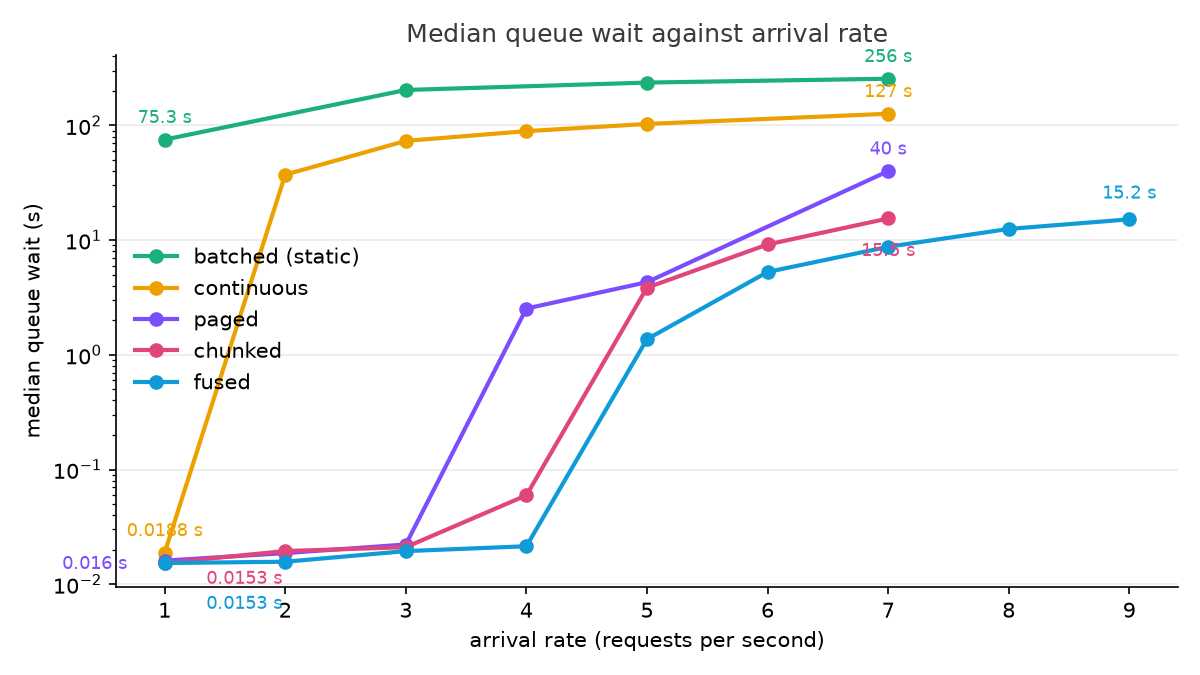
The sweep was extended to rate 9 because the served rate was still rising at rate 7, where the planned grid ended. It flattens at 4.53: the same number at rates 7 and 9 with 4.50 between them, so 4.53 is the engine's capacity, not a boundary artifact. Below saturation the queue benefit is larger than the capacity gain: at rate 5 the median request waits 1.38 s against 3.89, at rate 7 it waits 8.77 s against 15.47.
Per step timing on the disturbance workload, 64 mixed requests queued through 32 rows so admission happens continuously while incumbents decode, sync accurate, identical instrumentation for both engines:
| step kind | chunked | fused |
|---|---|---|
| loaded step (chunks and decodes together), p50 | 63.9 ms | 51.5 ms |
| loaded step, max | 154 ms | 66 ms |
| pure decode step, p50 | 30.4 ms | 31.3 ms |
| whole run, 500 steps | 20.7 s | 19.0 s |
Consecutive token gaps for the incumbents on that same workload:
| incumbent token gap | chunked | fused |
|---|---|---|
| median gap | 31.1 ms | 32.9 ms |
| worst gap | 77.5 ms | 69.5 ms |
| gaps over 150 ms | 0 of 48,320 | 0 of 48,320 |
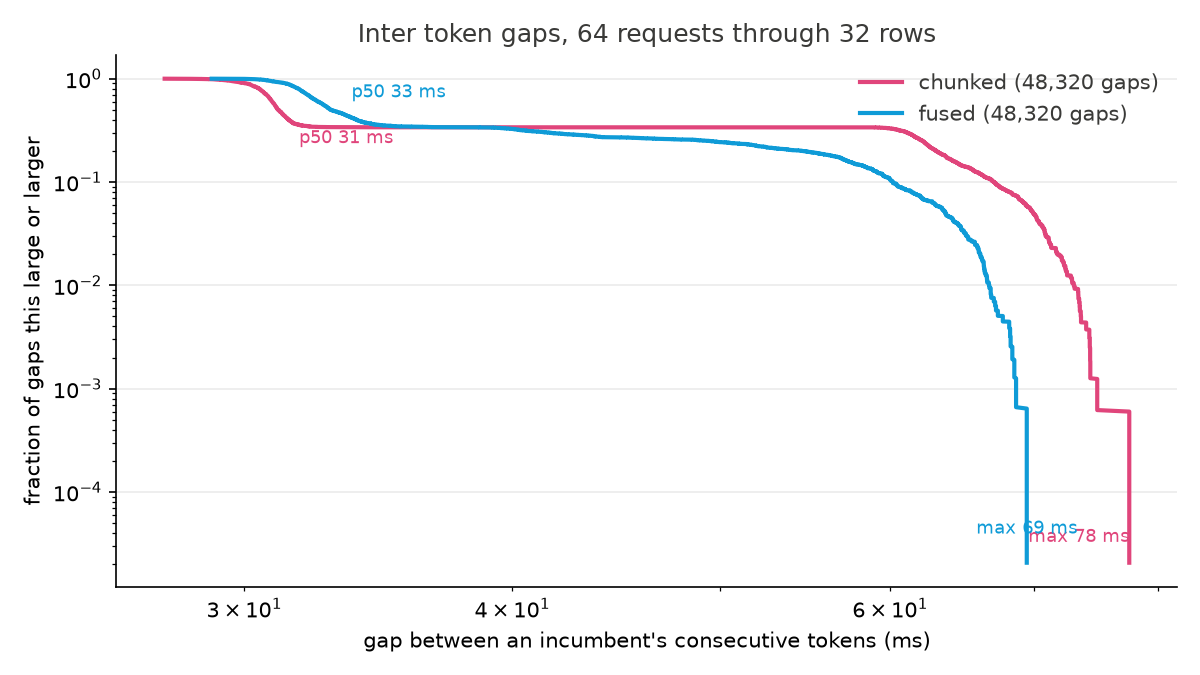
The median rose 6% because a decode token now shares its step with up to 512 prompt positions more often. The tail tightened for the same reason inverted: the worst an incumbent can wait is one fused step, and the worst fused step is 66 ms where the worst two forward step was 154.
The small pool control reruns unchanged: the pool capped at 0.5 GiB at rates 2 and 3. At rate 2 both engines serve 1.85 per second. At rate 3 the fused engine serves 2.53 against chunked's 2.43, 4% more, because a step that admits, chunks, and decodes in one forward turns the pool over slightly faster.
Why the capacity gain is 11% when loaded steps got 19% faster
Fusion only changes the steps that were running two forwards, and counting those steps explains the gain. The timing run above put 64 requests through 32 batch rows, so new requests kept being admitted while earlier ones were still generating. Its 500 steps break down as 350 that only decoded, 148 that carried prompt chunks and decode tokens together, and 2 that only chunked. Fusion saves 12.4 ms on each of the 148, the 63.9 minus the 51.5, and nothing on the other 352. That is 1.8 s out of the run's 20.7 s, 9%. The open loop sweep gains a little more, 11%, because at high arrival rates a larger share of steps carry both kinds. Fusion refunds the steps that paid twice, and those are about three steps in ten.
Why the uniform controls got slower
A closed batch of equal length prompts has almost no loaded steps: the batch prefills in a burst of chunk only steps, then decodes in pure decode steps, and the two kinds barely overlap. So the uniform controls collect fusion's costs with none of its benefit. The costs are real and small: the packed assembly builds its step tensors and two attention masks even when one kind is absent, and the pure decode step runs 0.9 ms slower than Part 6's dedicated decode forward, 31.3 against 30.4 ms. Across a run that is nearly all decode steps, that 3% per step is the 3% on batch 8 and, with the heavier prefill burst, the 5% on batch 32. Part 6's writeup predicted its uniform controls would get slightly worse and they got faster instead. This part's uniform regression is that prediction's logic finally landing on the engine it was written for: steps were added to the workload's cheapest phase.
Caveats
The mixed draws and the arrival traces are one seeded sample each, shared with Parts 3 through 6. A draw with more or fewer 4096 token prompts would change how many steps carry both kinds of work, and with it the whole capacity gain. That sensitivity has not been measured.
The step timings by kind come from a separate instrumented run that synchronizes around every forward. The synchronization adds about 5% to wall time, so those numbers compare across the two engines but not against the campaign runs.
Outputs are no longer byte identical to Part 6's. The fused forward multiplies its matrices at different shapes, cuBLAS picks a different kernel at a different shape, and when the top two logits are exactly tied the winner can change. The gates tolerate a flipped token only when the logit gap at the flip is under 0.02, and they count distinct flip locations. This campaign had one, an exact tie, and 30 of the 200 benchmark requests differ from Part 6's outputs downstream of it.
Bottleneck, and what follows
Loaded steps stopped paying for the model twice, and what remains is what each single forward costs. The pure decode step is 31.3 ms, and it decomposes into 5.15 ms of weight reading the hardware requires, about 10 ms of attention (0.347 ms per layer across 28 layers, a kernel that gives each request one query row and wastes 31 of each 32 wide query tile), and about 15 ms of everything else, the launch and execution cost of hundreds of small kernels at one token per row. Host overhead is already gone from that 15 ms: moving the step's bookkeeping to device resident buffers was measured at 2% in an earlier experiment this part absorbed.
Attention is the cleanest target in that decomposition: it is a quarter of the loaded step and a third of the decode step, and kernels that split the key value length across the GPU instead of across query rows are the standard fix for exactly this shape of work.
Prediction: cutting the per layer decode attention call from 0.347 ms to under 0.1 ms lands the pure decode step between 23 and 25 ms and the loaded step between 43 and 46 ms, and sustained service lands between 5.2 and 5.9 requests per second. If attention does not get faster, the served rate stays within noise of 4.53, since every other term in the step is untouched. The next writeup will grade all three.
Reproducing this
uv run modal run modal_app.py::gate_remote --script gate_fused
uv run modal run modal_app.py::kernel_gate_fused
uv run modal run modal_app.py::step_trace --engine-name chunked
uv run modal run modal_app.py::step_trace --engine-name fused

uv run modal run modal_app.py::main --engine fused --mixed-seed 0 --batch-size 8,32 --max-batch 32 --chunk-tokens 512
uv run modal run modal_app.py::main --engine fused --prompts p256 --batch-size 8,32 --max-batch 32 --chunk-tokens 512
uv run modal run modal_app.py::main --engine fused --mixed-seed 0 --batch-size 64 --max-batch 32 --chunk-tokens 512

uv run modal run modal_app.py::arrivals --engine fused --rates 7 --n-requests 400 --max-batch 32 --chunk-tokens 512
   (repeat for rates 9, 8, 6, 5, 4, 3, 2, 1, one invocation per rate)
uv run modal run modal_app.py::arrivals --engine fused --rates 3 --n-requests 400 --max-batch 32 --chunk-tokens 512 --pool-gib 0.5
uv run modal run modal_app.py::arrivals --engine fused --rates 2 --n-requests 400 --max-batch 32 --chunk-tokens 512 --pool-gib 0.5

uv run python scripts/plot_arrivals.py --out results/fused/arrivals.png
uv run python scripts/plot_fused.py
uv run python scripts/plot_steps.py
Greedy decoding, seed 0, Qwen2.5 1.5B fp16, Modal A10. Raw rows land in
results/fused/runs.csv, results/fused/runs.jsonl, and
results/fused/arrivals.csv. The gates run on the A10 through the
first command and compare the engine token for token against the Part 6
engine, including a dedicated gate for the step shape where prompt
chunks and decode tokens share one forward, a tiny pool admission gate,
and freed block poisoning under both attention backends. The synthetic
kernel measurement behind the attention split is decode_layout_bench,
and step_trace prints the per step timing by step kind.