Paged attention
infer/engines/pagedContents
Part 4's engine re formed the batch every step but computed every row's attention across the batch's widest row, and that held it at 1.25 requests per second however fast requests arrived. This part stores KV in fixed size blocks and gives the decode kernel each row's true length. The engine now serves 3 requests per second with the median request waiting 0.02 seconds, where Part 4's engine at the same arrival rate was saturated and the median request waited 73.4 seconds. The queue starts growing between 3 and 4 requests per second, and Part 4's recorded prediction of 2.5 to 3.5 sustained lands inside that window. The cost shows on uniform batches, where true lengths cannot help and the new kernel runs 28 to 30% slower than Part 4's.
What changed
Part 4's cache reserved one full width slot per row, 4352 tokens whether the row held 16 or 4096, and its decode masked the unused columns out. The mask hid the data but not the work: attention was computed across the widest row's span for all 32 rows. Both costs come from the same layout decision, so this part replaces the layout.
KV storage is now a pool of blocks, each holding 64 tokens of one request's keys and values. A request owns a block table, the ordered list of blocks its tokens live in, handed out from a free list at admission and returned when the request finishes. Eviction copies nothing: the Part 4 engine moved one row's KV per completion to keep its buffer compact, and this engine only edits the free list.
Admission follows a reserve on admit rule: a request is admitted only when every block it could ever need, prompt plus its full token budget, is free. A request that does not fit waits in the queue even if the batch has room. Nothing can run out of memory mid generation, so there is no preemption to implement or measure. The reservation rounds up to whole blocks, which wastes on average 32 tokens per request, 0.9 MB against the 78 MB an average request in this workload actually reserves.
The decode kernel is the real change. Each step it reads, for every row, only the blocks that row's table lists, at the row's own length. One 4096 token prompt in the batch no longer makes the other 31 rows compute 4096 wide attention. The kernel is compiled once at engine start, about a minute, so no measured step ever includes compilation. Prefill is unchanged from Part 4: newly admitted requests are batched together, left padded to the group's widest prompt, and run through the same attention path every earlier part used, after which each row's KV is copied into its blocks with the padding dropped.
Everything else is held where the earlier parts fixed it: Qwen2.5-1.5B in fp16, one Modal A10, the same five exact prompts, greedy decoding from seed 0, a 256 token budget unless a draw assigns a smaller one, 2 warmup and 5 recorded runs for closed configurations. Before any benchmark ran, the block machinery was checked token for token against Part 4's engine through a debug path that reads the same blocks with Part 4's kernel: single requests, a uniform batch, a mixed batch, and 8 requests queued through 4 slots all match exactly. The new kernel was then checked against that debug path on the same workloads. Its outputs differ from the old kernel's by about one part in a thousand in fp16, enough in principle to flip a greedy argmax where the top two logits nearly tie, but not one token flipped in any of the parity checks.
What I expected
Part 4 recorded this prediction:
Uniform batches of 32 decode at 1,264 to 1,400 tokens per second at every prompt length from 256 to 4096, so attention over true lengths at batch 32 should put the mixed draw's decode near that band rather than at 158. Discounting prefill share, which at rate r costs about
r x 1,100 / 5,900of wall time, capacity solves to roughly 3 requests per second: 158r tokens of decode at 1,300 tokens per second plus the prefill fraction reaches 1 at about r = 3.3. I expect the paged engine to sustain between 2.5 and 3.5 requests per second on this workload, to hold queue p50 under 1 second at rate 2, and the next writeup will grade both. The admission spike from a 4096 token prefill should not shrink, since paging changes where tokens live, not how a prompt is processed.
Sustained capacity: the engine keeps up at 3 requests per second, with the median queue wait at 0.02 seconds, and falls behind at 4, where the median wait grows to 2.5 seconds and keeps growing. The prediction's own arithmetic solved to r = 3.3, and the measured boundary sits between 3 and 4. Held.
Queue p50 at rate 2: measured 0.02 s against the predicted bound of 1 s. Held, and rate 2 is not even the interesting rate anymore. The same 0.02 s holds at rate 3.
The admission spike: a 4096 token prefill cost the running rows 682 to 685 ms per admission in this part against 685 to 692 in Part 4. Held, and a later section shows the spike is really about 280 ms per row in the admission group once padding is accounted for.
One piece of the prediction missed low. The mixed draw's decode reached 700 tokens per second, not the 1,264 to 1,400 band, because the new kernel is itself about 30% slower than the old one at equal work. The next section prices that.
Results
Six arrival rates, 400 requests each, 32 batch rows, replaying the same seeded traces Parts 3 and 4 ran, so every request arrives at the same moment for all three engines. Waiting is measured from arrival. Served rate is requests served divided by the span from first arrival to last completion.
| rate | queue p50 | queue p95 | TTFT p95 | served/s | Part 4 served/s | Part 4 queue p50 |
|---|---|---|---|---|---|---|
| 1/s | 0.02 s | 0.03 s | 0.30 s | 0.94/s | 0.94/s | 0.02 s |
| 2/s | 0.02 s | 0.09 s | 0.32 s | 1.85/s | 1.26/s | 37.2 s |
| 3/s | 0.02 s | 1.05 s | 2.65 s | 2.72/s | 1.24/s | 73.4 s |
| 4/s | 2.53 s | 4.21 s | 4.48 s | 3.45/s | 1.24/s | 89.3 s |
| 5/s | 4.30 s | 10.9 s | 11.0 s | 3.90/s | 1.19/s | 103.1 s |
| 7/s | 40.0 s | 67.9 s | 68.1 s | 2.90/s | 1.14/s | 126.6 s |
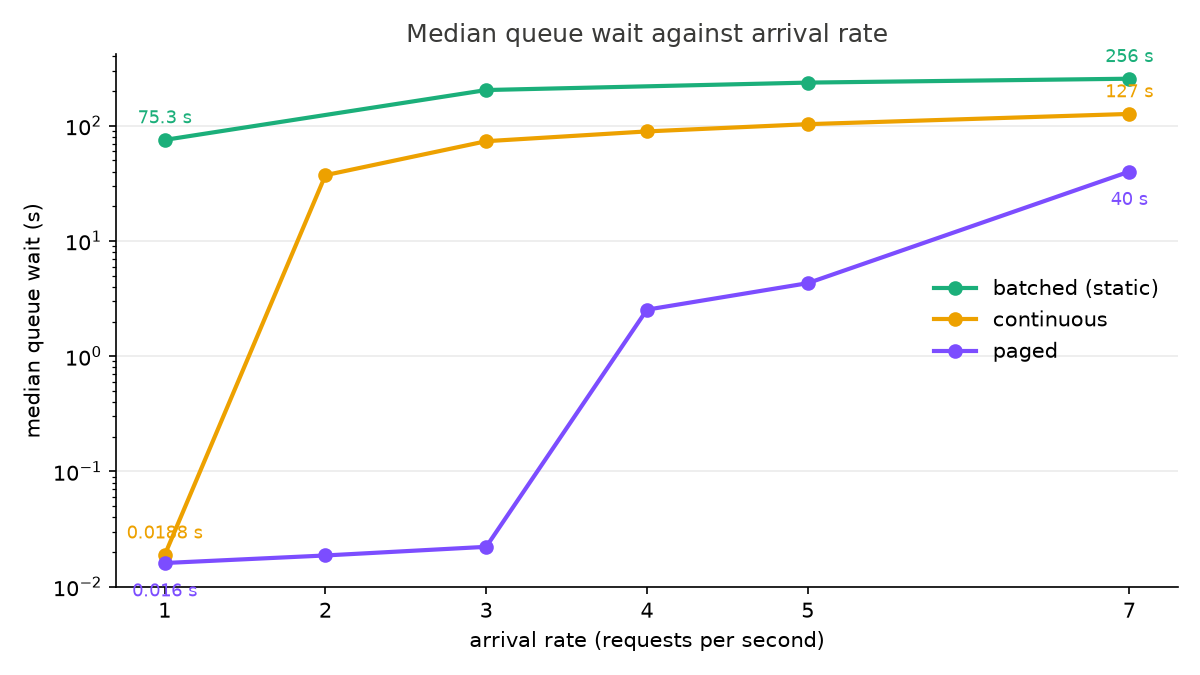
Rates 1 through 3 are stable: the queue never forms and the engine serves requests as fast as they arrive. Part 4's engine was already saturated at rate 2. At rates 4 and above the queue grows for as long as requests keep coming, which is what running past capacity looks like from outside.
The served rate above capacity is not flat. It peaks at 3.90 per second at rate 5 and falls to 2.90 at rate 7, so pushing this engine harder makes it serve slower. A later section locates that in the admission prefill.
The closed controls price the two sides of the kernel change directly. Each configuration below ran to completion 7 times, 2 warmup and 5 recorded, and the table reports the median wall time of the recorded runs.
| configuration | paged | Part 4 | Part 3 (static) |
|---|---|---|---|
| p256 uniform, 8 rows | 7.75 s | 6.06 s | 5.95 s |
| p256 uniform, 32 rows | 8.44 s | 6.48 s | 6.36 s |
| mixed draw, 8 rows | 10.05 s | 11.85 s | 14.33 s |
| mixed draw, 32 rows | 18.02 s | 34.32 s | 46.91 s |
On uniform batches every row is the same length, so reading true lengths buys nothing and the whole difference is the kernel itself: 28% slower at 8 rows and 30% at 32. This is the honest price of the change. The block reading kernel with its tile sizes chosen for correctness on both my laptop and the A10 does not match the fused attention path the earlier engines used, and no tuning pass has been spent on it. On the mixed draw the width win overwhelms that price: 15% faster than Part 4 at 8 rows and 47% faster at 32, which is 2.6x the static engine that started this series' batching work.
Where the mixed draw's time goes now
The 32 row mixed draw finishes in 18.02 s. Its decode, measured from each request's per token timestamps, runs at 700 tokens per second, against 1,052 for this engine's own uniform batch of 32 and against 158 for Part 4's entire mixed run. Attention at true lengths recovered most of the factor of 8 between Part 4's mixed and uniform decode, and the remaining gap to uniform is the thinning batch: rows finish and leave, so the average step runs fewer than 32 rows.
The surprise is the other half of the wall time. The first token appears at 10.31 s, and all of that is one prefill. The closed run admits all 32 requests in one group, the group is left padded to its widest prompt, and this draw contains 4096 token prompts. So the prefill processes 32 x 4096 = 131,072 padded positions to embed 44,048 real prompt tokens, 3.0 positions of work per useful token. More than half of the closed mixed run's wall time is one padded prefill doing three times the work its tokens need. Decode stopped paying for padding in this part. Prefill still pays for all of it.
Why the engine serves slower at rate 7 than at rate 5
The served rate peaks at 3.90 per second at rate 5 and drops to 2.90 at rate 7. Both rates are past capacity, so both run with a full batch and a growing queue, and naively the service rate should be the same. It is not, and the difference is how admissions group.
Requests admitted in the same step are prefilled together as one left padded batch. Call that an admission group. At rate 4 the median group has 1 request and the 95th percentile has 2. At rate 7 the median group has 2, the 95th percentile has 6, and the largest observed group has 16. Padding cost follows group size: pad a 16 token prompt into a group whose widest member is 4096 tokens and the prefill spends 256 positions of work per useful token on that row. Summed over each group, the median group at rate 7 wastes 0.60 padded positions per real prompt token and the 95th percentile group wastes 2.82, against 0.00 at the median for rate 4. That feeds back on itself: a deeper queue produces a larger admission group, a larger group pads more, and the slower prefill that results lets the queue grow further. The service rate at rate 7 is where that settles.
What admission costs the rows already running
The same closed run as Part 4 measures the disturbance directly: 64 mixed requests through 8 batch rows with per token timing on every request. The baseline gap between an incumbent's consecutive tokens is 29.8 ms, down from Part 4's 46.2, which is the true length decode showing up at small batch. The run contains 15 steps where the gap spiked past three times baseline, and the spike sizes now line up with the admission group's shape: a 4096 token prompt admitted alone stretches the incumbents' gap to about 280 ms, two admissions padded to 4096 stretch it to about 684 ms, and three stretch it to about 982 ms. Part 4 reported 685 to 692 ms per 4096 token admission, and its groups at that moment held two rows, so the prefill cost per padded row is unchanged, exactly as the prediction required. What Part 4 could not see, because its draws happened to clump, is that the spike is priced per padded row in the group, not per prompt.
What a small pool does
Everything above ran with the pool sized so that memory never binds, and the admission rule only ever waited on batch rows. One pair of runs caps the pool at 0.5 GiB, which is 292 blocks. The largest request needs 68 blocks, so nothing is ever refused outright, but the pool now holds only about 14 average requests' reservations at once.
| configuration | queue p50 | queue p95 | served/s |
|---|---|---|---|
| rate 2, 0.5 GiB pool | 1.18 s | 6.37 s | 1.85/s |
| rate 3, 0.5 GiB pool | 36.5 s | 64.4 s | 1.88/s |
| rate 2, default pool | 0.02 s | 0.09 s | 1.85/s |
| rate 3, default pool | 0.02 s | 1.05 s | 2.72/s |
The capped engine pins at about 1.9 requests per second at both rates. Rate 3, comfortably stable with the default pool, saturates with the small one. This is the first configuration in the series where memory, not compute, sets capacity: batch rows sit free while the head of the queue waits for blocks. The closed version of the same squeeze, 64 requests into 32 rows under the 292 block pool, finishes in 43.2 s, faster than the same 64 requests through 8 unconstrained rows at 48.5 s, because 14 effective rows still beat 8.
Sizing the default pool was itself a lesson in where this engine's memory actually goes. The first attempt gave the pool half of the memory left after the weights, about 9.7 GiB, and the mixed 32 row benchmark then died: the memory allocation for the admission prefill failed and the configuration was skipped. The transient peak of prefilling 32 requests padded to 4096 tokens is about 13 GiB, most of it two copies that exist only during the forward pass, the padded group's temporary KV and the expansion of 2 key value heads to 12 attention heads that the masked attention path materializes. A second attempt at a quarter of free memory failed the same way. The shipped default is 15% of free memory, about 2.9 GiB, which is still 4.5x what the arrival workload's live reservations ever reach, and the benchmark peak fits with about 3 GiB spare.
Caveats
The mixed draws and arrival traces are one seeded sample each, shared with Parts 3 and 4 by construction. A draw without 4096 token prompts would show smaller admission groups' padding waste and smaller spikes, and how much smaller is a distribution this series has not sampled.
The explanation for the served rate falling between rate 5 and rate 7 is measured group statistics plus the padding arithmetic, not a per step profile. A trace attributing each step's time to prefill and decode would pin it, and belongs to the part that changes how prefill is scheduled, since that is the change the answer would steer.
Three benchmark containers drew an A10G rather than an A10 from the cloud provider, which is a faster card and would have flattered these numbers. Two full runs were discarded after the device name recorded with each run gave them away, and every kept number in this file is from a verified A10. The same substitution reached one sweep earlier in the series, which is why the device name is now recorded and checked.
Bottleneck, and what follows
Decode stopped paying for padding in this part, and every cost that remains belongs to prefill. Three measurements say so. More than half the closed mixed run's wall time is one padded prefill doing 3.0 positions of work per useful token. The served rate falls 26% from rate 5 to rate 7 because deeper queues make bigger admission groups whose padding wastes up to 2.82 positions per token. And every admission still stalls running rows by about 280 ms per padded row in its group, unbounded, in the step it happens.
The next engine schedules prefill instead of letting admission size it: prompts processed at their true lengths rather than padded to the group's widest, and long prompts split into fixed chunks so decode steps interleave between chunks instead of stalling for the whole prompt.
Prediction
Removing prefill padding cuts the closed 32 row prefill from 131,072 positions to 44,048, so the closed mixed run should drop from 18.0 s to about 12 s: the 10.31 s prefill scaled by 44,048 / 131,072, plus the 7.7 s of decode that follows it unchanged. At arrival rates past capacity the same removal deletes the padding loop that pulls service from 3.90 down to 2.90 per second, so the served rate should hold near its peak at every rate from 4 through 7 rather than sagging. I expect the chunked engine to sustain between 3.5 and 4.5 requests per second, to keep queue p50 under 1 second at rate 3, and to cap the admission spike near the cost of one chunk, about 90 ms for a 512 token chunk at the measured 5,900 prompt tokens per second, against 280 to 982 ms here. The next writeup will grade all three. Chunking itself adds steps, so the closed uniform controls should get slightly worse, not better, and by how much is part of what the next part measures.
Reproducing this
uv run python scripts/gate_paged.py
uv run modal run modal_app.py::main --engine paged --prompts p256 --batch-size 8,32
uv run modal run modal_app.py::main --engine paged --mixed-seed 0 --batch-size 8,32
uv run modal run modal_app.py::main --engine paged --mixed-seed 0 --batch-size 64 --max-batch 8
uv run modal run modal_app.py::arrivals --engine paged --rates 7,5,4 --n-requests 400 --max-batch 32
uv run modal run modal_app.py::arrivals --engine paged --rates 3,2,1 --n-requests 400 --max-batch 32
uv run modal run modal_app.py::main --engine paged --mixed-seed 0 --batch-size 64 --max-batch 32 --pool-gib 0.5
uv run modal run modal_app.py::arrivals --engine paged --rates 3,2 --n-requests 400 --max-batch 32 --pool-gib 0.5
Greedy decoding, seed 0, 2 warmup and 5 recorded runs per closed
configuration. Raw rows are in the repo under results/paged/, one row
per request with its own timing, plus the arrival records beside them. The
disturbance numbers come from the per token times recorded for the 64 request
configuration, and the admission group statistics come
from the admission step index recorded per request in arrivals.csv. The
gate script checks token parity against the Part 2 and Part 4 engines on
the laptop before anything runs remotely. The first command in the modal
list rejects any container whose GPU is not an A10.